Original Link: https://www.anandtech.com/show/2034
Western Digital WD2500YD: Enterprise on the Desktop
by Gary Key on June 24, 2006 10:00 AM EST- Posted in
- Storage
Western Digital was founded in 1970 and began designing and manufacturing hard drives in 1988. The company is headquartered in Lake Forest, California, and employs approximately 23,000 people worldwide. Their innovative manufacturing facilities are located in Malaysia, California, and Thailand with research and design facilities in California. Western Digital has long been a leader in the ATA market. They were the first to adopt an eight megabyte drive buffer, first to reach 200GB drive size, and they are the only supplier offering a 10,000 RPM SATA drive with the class leading Raptor series.
Western Digital has recently updated their RE product line with the availability of the YD series of drives that feature a 16MB drive buffer, native 3Gb/s SATA support, and 7200 RPM spindle speeds. The YD series is available in 250GB and 160GB capacities and supplements the SD, SB, and YS product lineup. The SD series features 1.5Gb/s SATA support, 8MB drive buffer, and 7200 RPM spindle speeds with capacities ranging from 160GB to 320GB. The SB product is designed around an ATA 100MB/s interface, 8MB drive cache, 7200 RPM spindle speed and also comes in capacities ranging from 160GB to 320GB. The just released YS series features 3Gb/s SATA support, 16MB drive buffer, NCQ, and 7200 RPM spindle speeds with capacities ranging from 160GB to 500GB.
We consider the RE series to be the "budget" offerings from Western Digital in their nearline enterprise storage sector with the RE2 and Raptor series being slotted in the premium product range. The main differences between the RE and RE2 product lines are in capacities, mean time between failure (MTBF) rates, Native Command Queuing (NCQ, now available on the YS), Rotary Acceleration Feed Forward (RAFF) system, and component design choices. What this means is the RE2 product line is available in capacities up to 500GB, features a 1.2m MTBF rate compared to 1m for the RE series, available NCQ support, includes advanced anti-vibration logic for rack-mount servers (RAFF), and design aspects are based upon the Raptor series of products instead of the Caviar SE series.
Both product families feature five-year warranties, 24x7 100% duty cycle range, and Time Limited Error Recovery (TLER). TLER is a feature first introduced by Western Digital that reduces drive fallout by improving upon the communication coordination between the RAID controller and drive in handling drive errors. However, since the RE/RE2 drives expect to be connected to a RAID controller and handle error-recovery differently than the SE desktop product range, WD highly recommends against using these drives on the desktop.
Based upon the excellent performance of the RE2 drive series in the enthusiast market and the fact we have not experienced any direct issues with TLER enabled on the general desktop (although the possibility exists), we thought it might be interesting to see how these drives perform with our desktop benchmark suite. We should also note that the RE/RE2 drives carry a minimal cost penalty compared to their desktop counterparts. Whether this price difference justifies a purchase is up to the individual but the additional two year warranty, 24/7 operation rating, improved electronics, and other performance features of the RE/RE2 product seem to justify the cost in our opinion.
While our review today will concentrate on the desktop performance of the WD2500YD against the larger and more expensive RE2 drives we will be comparing this drive to its main competitors in the nearline enterprise storage sector, the Seagate NL35.1/NL35.2, new Western Digital YS family, and Maxtor MaXLine Pro series, in an upcoming article that will concentrate on RAID 0+1, 1, and 5 performance along with additional multi-tasking benchmarks. We have also just received additional Western Digital SE16, Western Digital RE16 YS, Seagate 7200.10, and revised Hitachi drives so our next desktop roundup will feature direct comparisons between the nearline enterprise and desktop products.
Let's see how this RE16 drive performs against the RE2 and Raptor based drives.
Feature Set
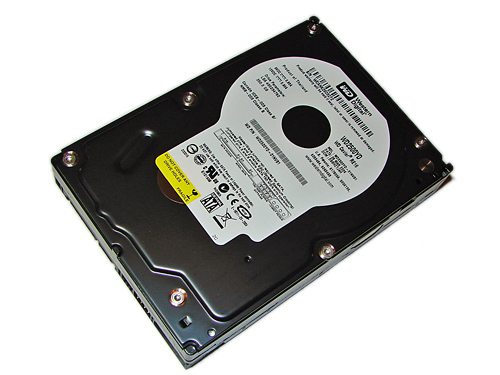
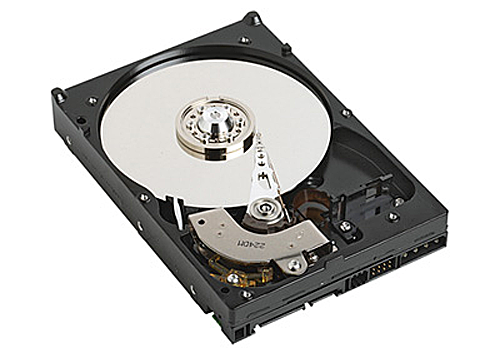
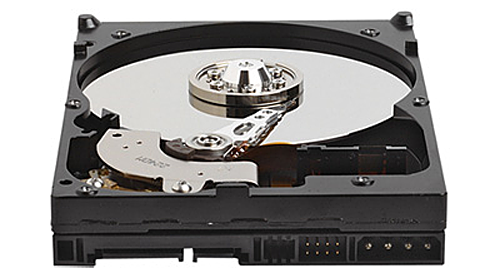
The external design of the Western Digital RE16 series is basically unchanged from the RE2 and Raptor series as it features the now familiar black casing. The drive is based on the industry standard 3.5" form factor platform with pertinent part number and warranty information embossed on a white sticker on the top of the casing.
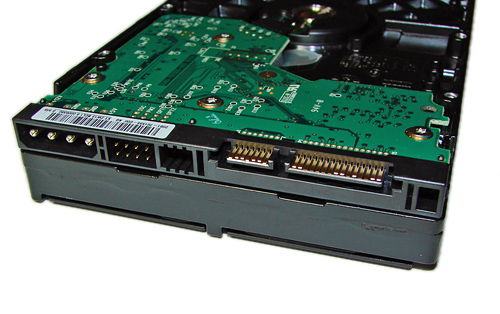
The RE16 family ships with the Serial ATA data and power connector along with a 4-pin Molex power connector designed for use with older ATX power supplies. To the left of the SATA data and power connectors is an eight-pin jumper block. This jumper block can be utilized to implement spread spectrum clocking or force SATA 1.5Gbs operation. This drive ships with SATA 3Gbs operation enabled. While this feature was advantageous for burst transfer rates in our synthetic benchmarks, overall we did not see any real improvement in our real world benchmarks.
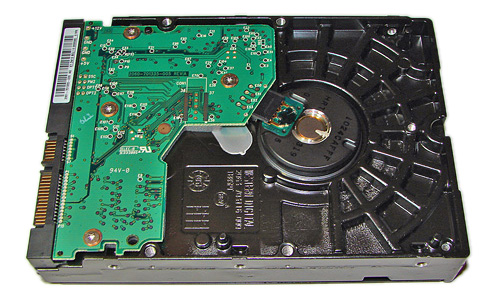
The PCB is openly visible on the bottom of the drive, and as in the previous series the 16 MB of cache memory and controller chips are located on the opposite side of the PCB. All in all, it's a very normal design; it is very difficult to make a hard drive look sexy unless you happen to have a windowed Raptor in your case.
Hardware Setup
| Standard Test Bed Playback of iPEAK Trace Files and Test Application Results |
|
| Processor: | AMD Opteron 170 utilized for all tests. |
| RAM: | 2 x 1GB Corsair 3500LL PRO |
| Settings- DDR400 at (2.5-3-3-7, 1T) | |
| OS Hard Drive: | 1 x Maxtor MaXLine III 7L300S0 300GB 7200 RPM SATA (16MB Buffer) |
| System Platform Drivers: | NVIDIA Platform Driver - 6.85 |
| Video Card: | 1 x Asus 7600GS (PCI Express) for all tests. |
| Video Drivers: | NVIDIA nForce 84.21 WHQL |
| Optical Drive: | BenQ DW1640 |
| Cooling: | Zalman CNPS9500 |
| Power Supply: | OCZ GamexStream 700W |
| Case: | Gigabyte 3D Aurora |
| Operating System(s): | Windows XP Professional SP2 |
| Motherboards: | MSI K8N Diamond Plus |
We have changed our test beds to reflect changes in the current marketplace. While we wanted to change to the AMD AM2 or Intel Core 2 Duo platform, the product release schedules forced us into staying with a socket 939 based system. Based upon the continuing proliferation of dual core processors and future roadmaps from AMD and Intel signifying the end of the single core processor on the desktop in the near future we have upgraded from our AMD Athlon64 3500+ to an AMD Opteron 170. This change will also allow us to expand our real world multitasking benchmarks in the near future. We will review our test bed requirements once we have an opportunity to thoroughly test the AM2 and Intel Core 2 Duo platforms in the coming weeks.
We debated on the memory size for our iPEAK trace file creations and decided to move to 2GB of system memory. A system with a 1GB memory configuration is the predominant standard at this time in the enthusiast community although 2GB memory setups are becoming more common. While a 1GB memory installation allows us to capture and report a higher amount of disk activity in certain applications, we decided to make the switch at this time as the difference is minimal when compared to the 1GB trace files.
Software
With the variety of disk drive benchmarks available, we needed a means of comparing the true performance of the hard drives in real world applications. While we will continue to utilize HDTach and PCMark05 for comparative benchmarks our logical choice for application benchmarking is the Intel iPEAK Storage Performance Toolkit version 3. We originally started using this storage benchmark application in our Q2 2004 Desktop Hard Drive Comparison: WD Raptor vs. the World article. The iPEAK test can be designed to measure "pure" hard disk performance, and in this case, we kept the host adaptor consistent while varying the hard drive models. The idea is to measure the performance of individual hard drives with a consistent host adaptor.
We utilize the iPEAK WinTrace32 program to record precise I/O operations when running real world benchmarks. We then utilize the iPEAK AnalyzeTrace program to review the disk trace file for integrity and ensure our trace files have properly captured the activities we required. Intel's RankDisk utility is used to play back the workload of all I/O operations that took place during the recording.
RankDisk generates results in a mean service time in milliseconds format; in other words, the average time that each drive took to fulfill each I/O operation. In order to make the data more understandable, we report the scores as an average number of I/O operations per second so that higher scores translate into better performance in all of our iPEAK results. While these measurements will provide a score representing "pure" hard drive performance, the actual impact on the real world applications can and will be different.
The drive is formatted before each test run and three tests are completed on each drive in order to ensure consistency in the benchmark results. The high and low scores are removed with the remaining score representing our reported result. We utilize the NVIDIA nF4 SATA ports along with the NVIDIA IDE-SW driver to ensure consistency in our playback results when utilizing NCQ, TCQ, or RAID settings.
Our iPEAK tests represent a fairly extensive cross section of applications and usage patterns for both the general and enthusiast user. We will continually tailor these benchmarks with an eye towards the drive's intended usage and feature set when compared to similar drives. In essence, although we will report results from our test suite for all drives, it is important to realize a drive designed for PVR duty will generate significantly different scores in our gaming benchmarks than a drive designed with gaming in mind such as the WD Raptor. This does not necessarily make the PVR drive a bad choice for those who capture and manipulate video while also gaming. Hopefully our comments in the results sections will offer proper guidance for making a purchasing decision in these situations.
Our iPEAK Test Suite consists of the following benchmarks
VeriTest Business Winstone 2004 - trace file of the entire test suite that includes applications such as Microsoft Office XP, WinZip 8.1, and Norton Antivirus 2003.
VeriTest Multimedia Content Creation 2004 - trace file of the entire test suite that includes applications such as Adobe Photoshop 7.01, Macromedia Director MX 9.0, Microsoft Windows Media Encoder 9.0, Newtek Lightwave 3D 7.5b, and others.
AVG Antivirus 7.1.392 - trace file of a complete antivirus scan on our test bed hard drive.
Microsoft Disk Defragmenter - trace file of the complete defragmentation process after the operating system and all applications were installed on our test bed hard drive.
WinRAR 3.51 - trace file of creating a single compressed folder consisting of 444 files in 10 different folders totaling 602MB. The test is split into the time it takes to compress the files and the time it takes to decompress the files.
File Transfer - individual trace files of transferring the Office Space DVD files to our source drive and transferring the files back to our test drive. The content being transferred consists of 29 files with a data content of 7.55GB.
AnyDVD 5.9.6 - trace file of the time it takes to "rip" the Office Space DVD. We first copy the entire DVD over to our Seagate 7200.10 750GB source drive, defragment this drive, and then measure the time it takes for AnyDVD to "rip" the contents to our test drive. While this is not ideal, it does remove the optical drive as a potential bottleneck during the extraction process and allows us to track the write performance of the drive.
Nero Recode 2 - trace file of the time it takes to shrink the entire Office Space DVD that was extracted in the AnyDVD process into a single 4.5GB DVD image.
Video Streaming - trace file of the time it takes to capture and record Chapter 11 of Office Space with our NVIDIA DualTV MCE tuner card while viewing Chapter 10 utilizing PowerDVD 6. Chapter 10 has already been recorded and is playing from our source drive while Chapter 11 is being streamed from our Media Server.
Audio Encoding / Video Capture - trace file of the time it takes Nero Digital Audio to extract all 16 tracks from the INXS Greatest Hits CD and convert them into an mp4 format while capturing and recording Chapter 11 of Office Space with our NVIDIA tuner card. We changed the Nero default quality settings to transcoder-ultra, variable bit rate, encoder quality to high, and the AAC profile to LC.
Game Installation - individual trace files of the time it takes to install Oblivion, Sims2, and Battlefield 2. We copy each DVD to our secondary Seagate 750GB drive, defragment the drive, and then install each game to our source drive.
Game Play - individual trace files that capture the startup and about 15 minutes of game play in each game. Our Oblivion trace file consists of visiting 16 different areas within the game, interacting with individual characters, and passing through three different gates. The Sims2 trace file consists of the time it takes to select a pre-configured character, setup a university, downtown, business from each expansion pack (pre-loaded), and then visit each section before returning home. Our final trace file utilizes Battlefield 2 and we play the Daquing Oilfield map in both single and multiplayer mode.
Features
| Hard Drive Specifications | ||||
| Western Digital Raptor WD1500AHFD | Western Digital RE2 WD5000YS | Western Digital RE2 WD4000YR | Western Digital RE WD2500YD | |
| Manufacturer's Stated Capacity | 150GB | 500GB | 400GB | 250GB |
| Operating System Stated Capacity | 139.7GB | 465.8GB | 372.6GB | 233.7GB |
| Interface | SATA 1.5Gb/s | SATA 3Gb/s | SATA 1.5Gb/s | SATA 3Gb/s |
| Rotational Speed | 10,000 RPM | 7,200 RPM | 7,200 RPM | 7,200 RPM |
| Cache Size | 16 MB | 16 MB | 16 MB | 16 MB |
| Average Latency | 2.99 ms (nominal) | 4.20 ms (nominal) | 4.20 ms (nominal) | 4.20 ms (nominal) |
| Read Seek Time | 4.5 ms | 8.7 ms | 8.7 ms | 8.9 ms |
| Number of Heads | 4 | 8 | 8 | 4 |
| Number of Platters | 2 | 4 | 4 | 2 |
| Power Draw Idle / Load | 9.2W / 10.0W | 8.9W / 10.8W | 8.9W / 10.8W | 8.7W / 9.5W |
| Command Queuing | Native Command Queuing | Native Command Queuing | Native Command Queuing | Not Applicable |
| Warranty | 5 Years | 5 Years | 5 Years | 5 Years |
The Western Digital WD2500YD 250GB drive we are reviewing today will be compared against the leading RE2 Western Digital drives along with the drive that has redefined performance in the Serial ATA market, the WD1500 Raptor. We have also included the results of the Seagate 7200.10 750GB and 7200.09 500GB drives from our previous article. As a side note, the manufacturer and operating system drive capacities reported are different due to the calculation utilized by each party to arrive at the drive's stated capacity. There is not an actual difference in the drive's size after the operating system formats the drive.
While the Seagate drives are not in the same market sector as the RE/RE2 based drives, we thought it would be interesting to see how other desktop centric drives would perform in our testing. We will be comparing our RE16/RE2 drives to the recently released Seagate NL35.2 and Maxtor MaXLine Pro drives in the near future with an emphasis on nearline enterprise storage capabilities. We will provide additional reviews in the coming weeks for the desktop centric drives in both the 500GB and 250GB~320GB capacity ranges.
HDTach Performance:
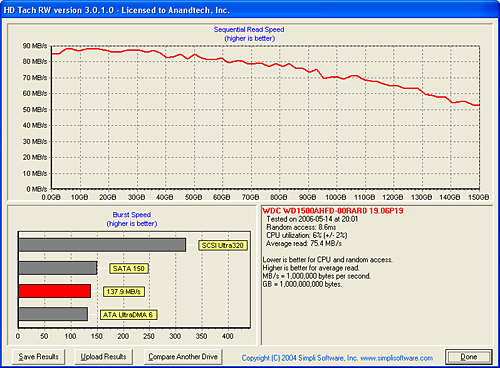


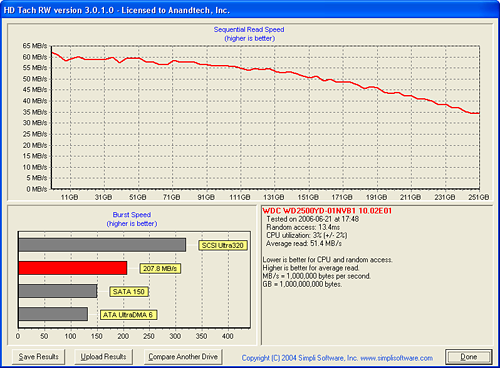
We find HD Tach to be useful for generating random access and average transfer rate results in a very consistent manner. Although the burst rates and CPU utilization numbers appear interesting, they tend to be meaningless in actual application performance comparisons.
The Raptor has the highest average sequential read speed of 75.4 MB/s with the RE2 500GB drive at 62.4 MB/s, RE2 400GB drive at 57.0 MB/s, and the RE16 250GB drive at 51.4 MB/s. The WD 500GB and 400GB drives score about 40 MB/s at the end of the disk with the 250GB drive at 35 MB/s. In contrast, the WD Raptor finishes with a 52 MB/s result that is more than 30% greater than the 7200 RPM drives. However, if you look at the read performance for the first 150GB on the 7200 RPM drives, all three manage higher than or equal to the minimum transfer rates of the Raptor.
The random access time benchmark favors the 10,000RPM spindle speed of the Raptor which generates a result of 8.6ms. The 7200RPM drives results are close with the nod going to the 500GB and 250GB drives at 13.4ms while the 400GB drive finishes at 13.5ms. The average rotational latency at 10,000 RPM is 3ms while the average rotational latency at 7200 RPM is 4.17ms; what this means is that the head seek speed on the Raptor is significantly faster (~5.6ms) than the other drives (9.2-10.0ms). Although the WD2500YD has very good burst rates we will soon see this does not always translate into class leading performance.
PCMark05
We are utilizing the HDD test suite within PCMark05 for further comparative hard disk scores as it provides a mixture of actual application results and specific read/write percentages utilized within these programs. This also provides a standardized industry benchmark that can be used by others for comparison with our results. The program utilizes the RankDisk application within the Intel iPEAK SPT suite of tools to record a trace of disk activity during usage of real world applications. These traces are then replayed to generate performance measurements based upon the actual disk operations within each application. The HDD test suite contains 53% read and 47% write operations with each trace section utilizing varied amounts of read or write operations. Additional information about the test suite can be found in PDF format here: PCMark05 whitepaper.
Our test results are based upon the following trace runs:
Windows XP Startup: This test consists of 90% reading and 10% writes that tracks XP activities at start-up.
Application Loading: This test consists of 83% reading and 17% writes that tracks the opening and closing of the following programs.
Microsoft Word
Adobe Acrobat Reader
Windows Media Player
3Dmark 2001SE
Leadtek WinFast DVD
Mozilla Internet Browser
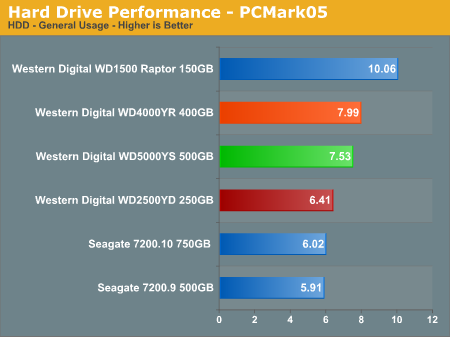
General Hard Disk Drive Usage: This test consists of 60% reading and 40% writes that tracks application usage utilizing the following settings.
Opening a Microsoft Word document, performing a grammar check, saving and closing.
Compression and decompression using WinZip
Encrypting and decrypting a file using PowerCrypt
Scanning files for viruses using F-Secure Antivirus
Playing an MP3 file with Winamp
Playing a WAV file with Winamp
Playing a DivX video using DivX codec and Windows Media Player
Playing a WMV video file using Windows Media Player
Viewing pictures using Windows Picture Viewer
Browsing the Internet using Microsoft Internet Explorer
Loading, playing and exiting a game of Tom Clancy's Ghost Recon
Virus Scanning: This test consists of 99.5% read operations as the test tracks the scanning activities of 600MB of files for viruses.
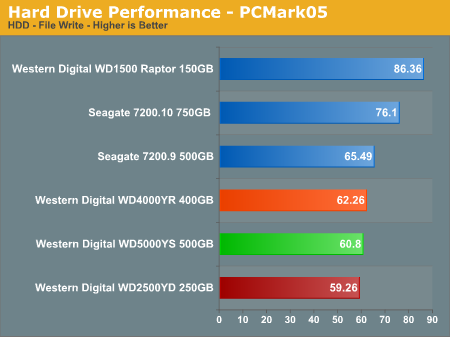
File Write: This test consists of 100% write activities by writing 680MB of files onto the hard disk.
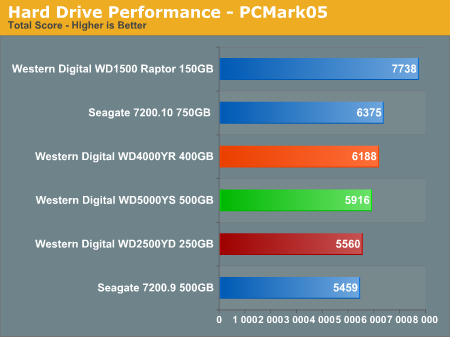
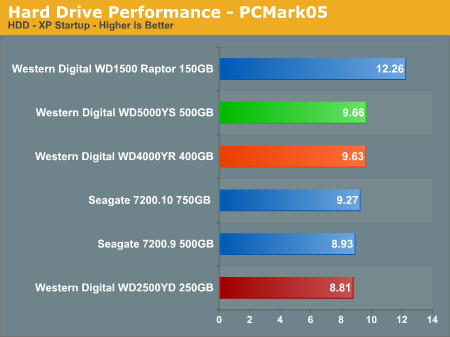
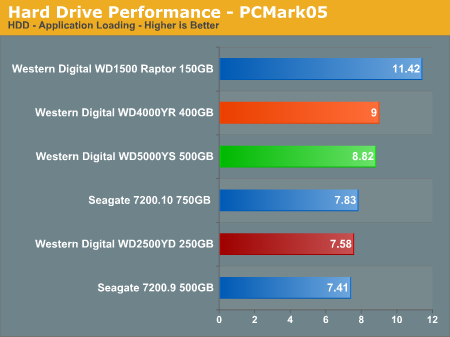
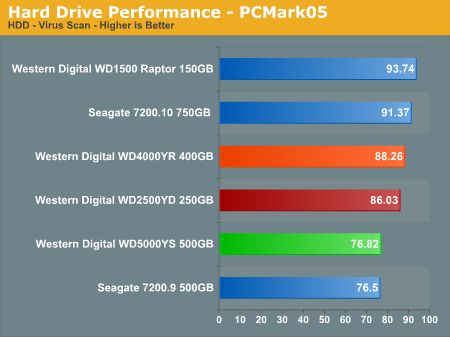
Our PCMark05 numbers follow a familiar test pattern with the WD Raptor having a 39% advantage over the WD2500YD drive in the total score number. The performance delta between the two RE2 drives and our RE test drive is minimal with the RE drive displaying very good results in the virus scan test while the WD5000YS displays sub-par performance that is also mirrored in our iPEAK virus scan test.
The general usage and application benchmarks that represent the majority of daily operations on a typical PC configuration favor the Western Digital drives. The Western Digital 500GB and 400GB RE2 drives are basically even throughout these tests with the RE 250GB drive trailing but still remaining competitive with the other drives. Our RE16 and RE2 drives all finish at the bottom of the File Write test even though these drives are touted for their excellent write performance capabilities. We believe the short file sizes and very sequential nature of the test file favors the Raptor and Seagate drives. The Raptor basically runs off and leaves the competition in the dust in the PCMark05 benchmarks.
iPEAK Business Application Tests
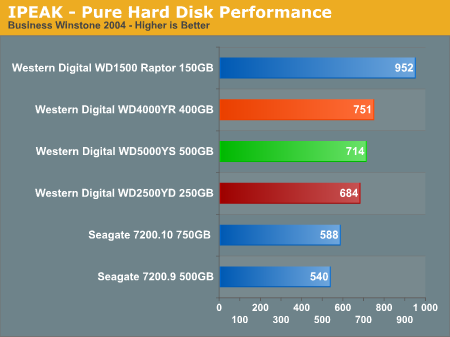
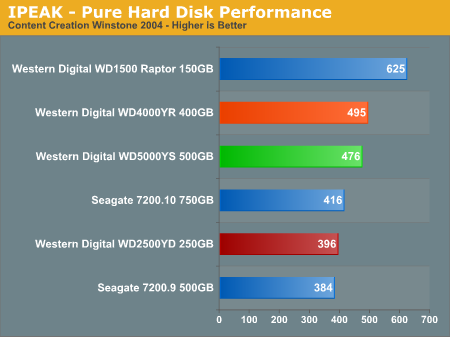
Our iPEAK Winstone benchmarks offer a glimpse into how well our hard disk drives will handle general office applications, media encoding, and graphics manipulation. While the business applications that are being tested tend to be more CPU bound at times, the performance of the hard drive can and will make a difference in the more disk intensive video and graphics applications where large media files are typically being edited.
As expected the WD Raptor places first as its 10k RPM spindle speed and optimized cache play an important role in its ability to sustain high transfer rates, especially in the Content Creation benchmark where transfer block sizes are significantly larger than in the Business application benchmark. The WD RE2 400GB drive makes a very strong showing in these benchmarks as it continues its slight lead over the RE2 500GB drive with our RE16 250GB trailing behind but still placing ahead of the Seagate drives in the Business Winstone benchmark and splitting the middle in the Content Creation test.
iPEAK General Task Tests
The iPEAK based General Task benchmarks are designed to replicate utility based application tasks that typically are disk intensive and represent common programs utilized on the majority of personal computers. While the WinRAR program is very CPU intensive it will typically stress the storage system in short bursts. Our antivirus benchmark will stress the storage system with continual reads and sporadic write requests while the defragmentation process is split between continual read and write requests.
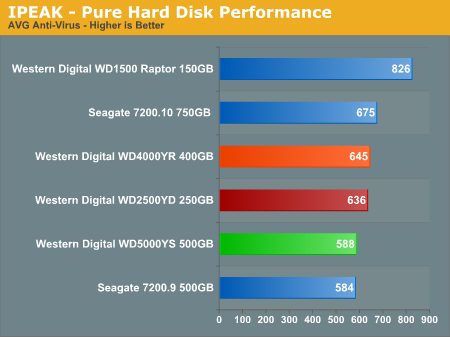
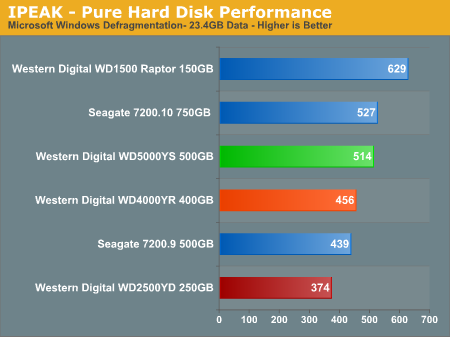
The WD RE2 500GB drive flips the table on the RE2 400GB drive while posting better numbers in all tests except the antivirus test where it continues to show weak results compared to the other WD drives. The WD2500YD is very competitive in this series of tests except in the defragmentation test where is finishes last and is a good 37% slower than the WD RE2 500GB drive. We also completed a separate application timing program on an identical drive image with the same percentage differential being posted between the two drives utilizing the XP defragmentation program. The WD RE2 500GB finished a good 4 minutes quicker. We noticed the RE16 250GB drive would stutter and pause at certain points in the process while the RE2 drives remained constantly active.
iPEAK File Transfer Tests
Our iPEAK based File Transfer benchmarks indicate how well a drive performs in a strictly read or write operation with a limited number of files (29) but a large amount of data (7.55GB). The test is designed to ensure continual write or read operations across a large section of the drive that requires constant head and actuator movements along with caching large amounts of data.
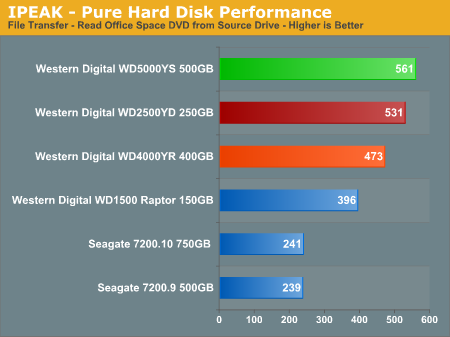
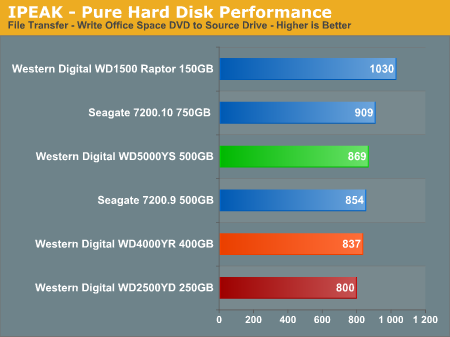
The read performance of the WD2500YD is impressive in these benchmarks while the write performance continues to be lackluster when compared to the other drives. The performance of WD RE2 500GB drive was fantastic in the read section and then fell in behind the WD Raptor and Seagate 7200.10 in the write performance benchmark; however, it continues to lead the RE2 400GB drive in both benchmarks.
The Seagate 7200.10 and 7200.9 read performance is dismal compared to the WD drives, but their write performance is very good. This is interesting as their read performance in the antivirus test was excellent. After further examination of the trace files we noticed the read requests in the antivirus test consisted of mostly small blocks sizes in irregular patterns compared to very large block sizes in a continual pattern in the file transfer test. Apparently, the Seagate drives handle small transfers better than sustained larger transfers, so the large files used here hampered their performance.
iPEAK Video/Audio Tests
The iPEAK based Video/Audio benchmarks are designed around media encoding and simulating HTPC activities. These are basic benchmarks at this time as this section will be expanded greatly with some new tools that we have developed that will be introduced in our 500GB roundup. Our change to a dual core processor will assist us in maintaining a balance between the CPU and Storage systems during the trace file creation and benchmarking processes. These benchmarks are CPU intensive in nature but also require a balanced storage system with the ability to handle read and write requests simultaneously in a very efficient manner.
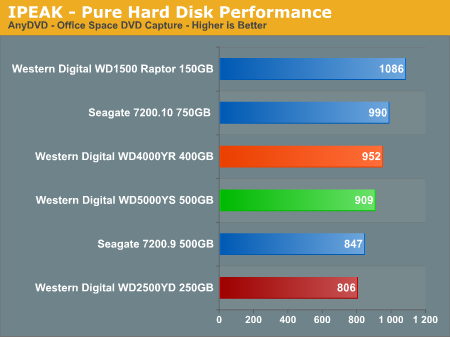
The AnyDVD benchmark is heavily weighted to write requests with the results showing a common pattern with the WD Raptor finishing first and the WD2500YD trails behind the balance of the field. The WD RE2 400GB drive finishes slightly ahead of the RE2 500GB and 18% ahead of the RE 250GB drive. The Seagate 750GB 7200.10 posts very good scores in this area and should since its capacity lends itself well to this process.
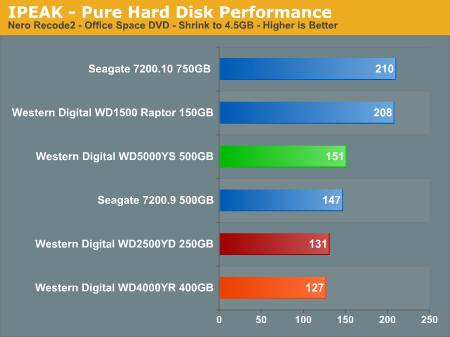
The NeroRecode 2 benchmark is weighted to streaming read requests but is balanced by continuous write operations. This benchmark is one of the most demanding ones in our test suite with the disk being active the entire trace file with several 100% utilization peaks. The Seagate 7200.10 posts the best scores here with a victory over the Raptor and finishes ahead of the other WD drives. The WD2500YD places ahead of the RE2 400GB but does not offer the same strong read performance we noticed in the file transfer tests where a limited number of like file sizes are utilized.
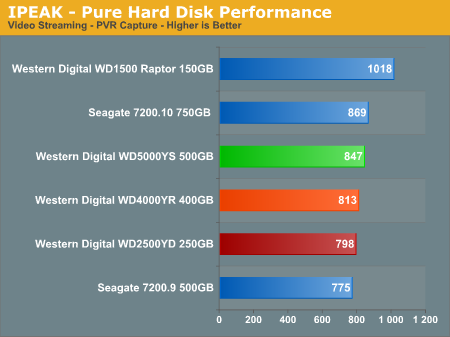
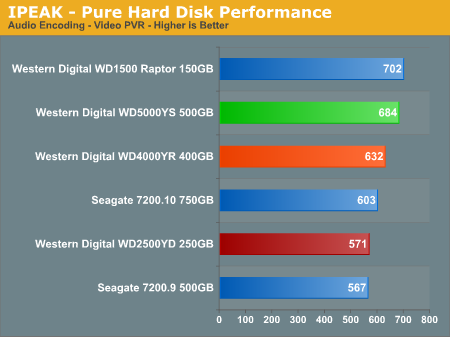
Our video and audio encoding benchmarks that stream a continuous data feed clearly favor the high and sustainable transfer rates of the Raptor. While falling behind the RE2 drives in these two benchmarks, the WD2500YD has no trouble finishing ahead of the Seagate 7200.9 500GB drive. The Seagate 7200.10 and WD5000YS both offer very balanced performance in the larger drive capacities.
iPEAK Game Installation Tests
Our iPEAK based Game Installation benchmarks simply show the ability of the hard drive to write data as quickly as possible to the disk based upon the installation software instructions. As detailed in our iPEAK setup description we installed the games from our source drive in order to eliminate the optical drive bottleneck. In separate application timing we witnessed basically the same percentage spread when installing the games via our DVD drive so these results are representative of actual installation performance.
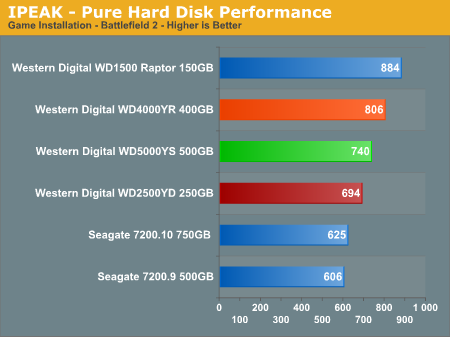
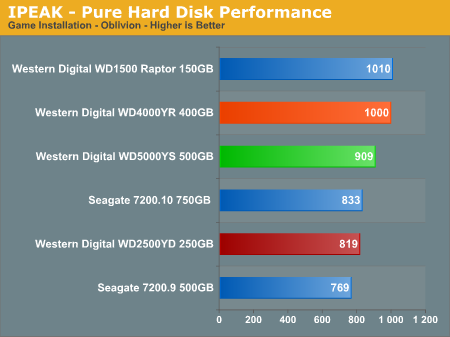
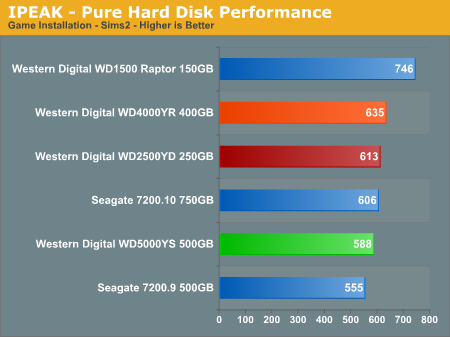
We see both WD RE2 drives performing very well in these benchmarks with the WD Raptor simply dominating the other drives in these tests. The write performance of the WD2500YD is very good in the Sims2 benchmark as the disk utilization results are very consistent along with a close grouping of block sizes in this test. The drive performs well when seek distances are evenly distributed with large block sizes of data. The performance of the WD2500YD trails off in the Oblivion and Battlefield 2 benchmarks as the disk utilization numbers begin to vary along with seek distances that are not serial in nature, but it still remains competitive with the Seagate desktop drives.
iPEAK Game Play Tests
The iPEAK based Game Play tests are centered on the benefits of having a hard disk that can load non-linear or sequential data files quickly without interrupting the flow of the game.

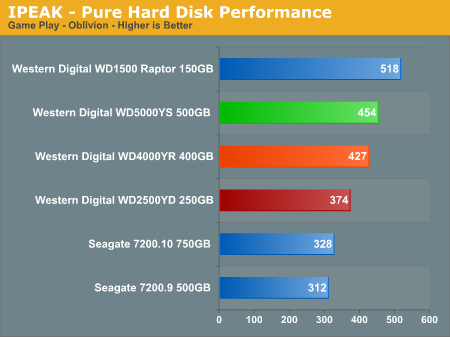
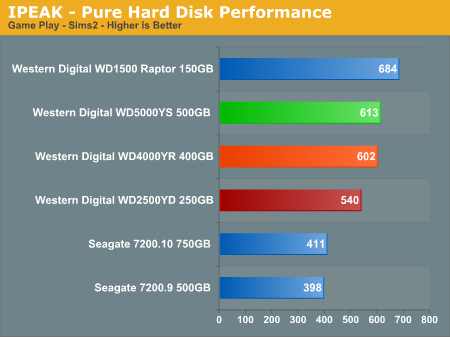
We're sounding like a broken record, but the WD Raptor places first as its 10k RPM spindle speed and optimized cache play an important role in its ability to sustain high transfer rates. The WD2500YD is up to 39% slower than the two RE2 drives but still manages to better the desktop centric drives from Seagate. While these differences sound large, in actual desktop usage most users will not be able to tell the difference except when utilizing the Raptor in certain situations. Also, the selection of platform components will have a far greater impact on a drive's responsiveness than the drive itself in many cases.
Our application time tests are designed to show application performance results with times being reported in minutes / seconds or seconds only with lower scores being better. While these tests will show some differences between the drives it is important to understand we are no longer measuring the pure performance of the hard drive but how well our platform performs with each individual drive. The performance of a hard drive is an integral part of the computer platform but other factors such as memory, CPU, core logic, and even driver choice can play a major role in determining how well the hard drive performs in any given task.
Game Load Tests
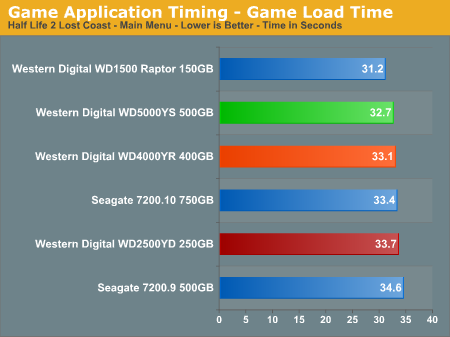
In our Half-Life 2: Lost Coast test we measure the time it takes to load the game with the application timer starting when the play game icon is initiated in the Steam menu until the Main game menu appears. The results follow our overall iPEAK game results with the Western Digital Raptor performing up to 10% better in this benchmark. The WD 2500YD continues to show a pattern of finishing slightly behind the other drives but the performance difference requires a benchmark to notice and most people won't be able to tell the difference during actual gameplay.
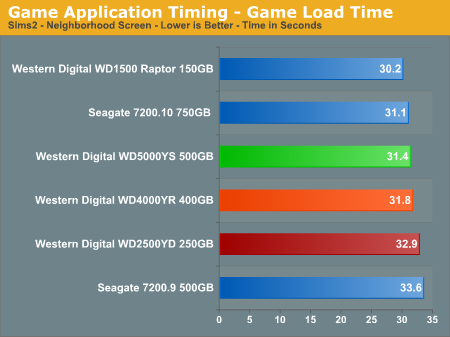
Our Sims 2: Open for Business test measures the time it takes to load the initial portion of the game. Our application timer starts when the game icon is initiated until the neighborhood menu appears. The results are basically the same as our Half Life 2 results as the WD Raptor continues to lead all drives, but the Seagate 7200.10 finishes ahead of the RE2 drives this time.
Game Level Load
These tests center around the actual loading of a playable level within our game selections.
The Battlefield 2 test measures the time it takes to load the Daqing Oilfields level. We begin timing right after initiating a single player game and stop when the join game icon is visible.
The Half-Life 2: Lost Coast test measures the time it takes to load a new game. Our application timer starts when the start new game option is selected and ends when the character is on screen with the 357 magnum visible.
The Oblivion test measures the time it takes to load the Weye level in our saved game files. We measure the amount of time from loading the saved game until the character is visible on screen.
The Sims 2: Open for Business test measures the time it takes to load the Downtown sector of the game from Veronaville. We start our application timer when the Downtown game icon is selected and stop when the downtown graphics are visible.
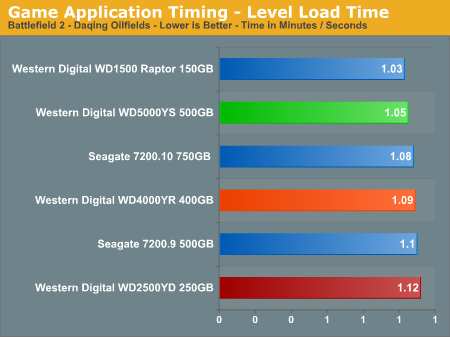
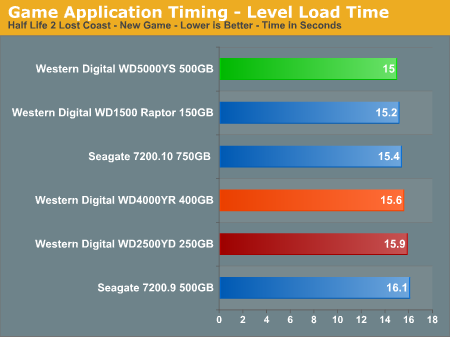
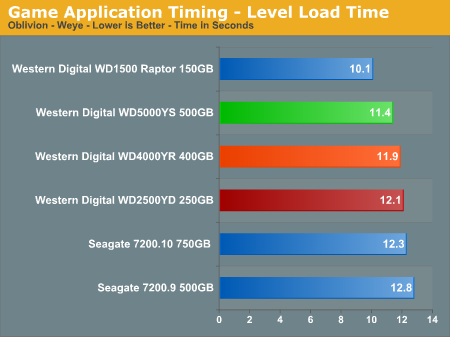
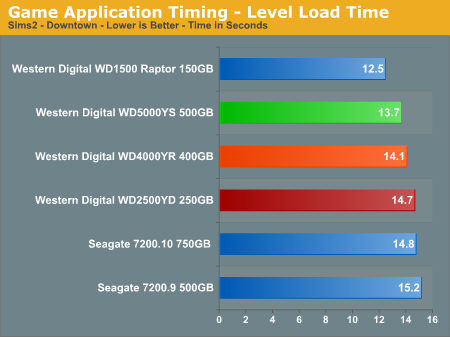
The WD Raptor continues its pattern of being the best available drive for the gaming enthusiast, although with a limited storage capacity it is certainly an expensive proposition for the general desktop user who typically will sacrifice speed for storage. Our WD2500YD continues to finish in the middle or at the back of the pack in these tests with the only noticeable differences being in our Oblivion and Sims 2 levels where there was some separation between the Raptor and our test drive.
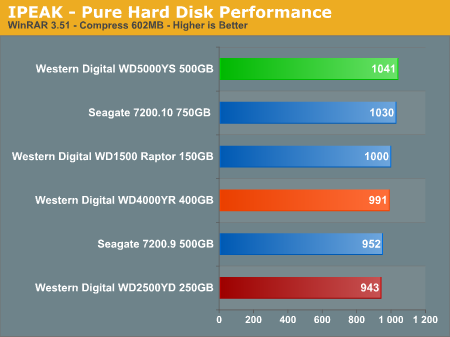
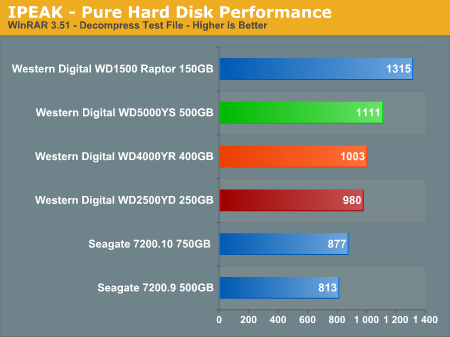
WinRAR 3.51
Our WinRAR tests measure the time it takes to compress our test folder that contains 444 files, 10 folders, and contains 602MB of data. This is same test folder utilized in our iPEAK test suite. While the benchmark is extremely CPU intensive for the compression test it still requires a fast storage system to keep pace with the CPU.
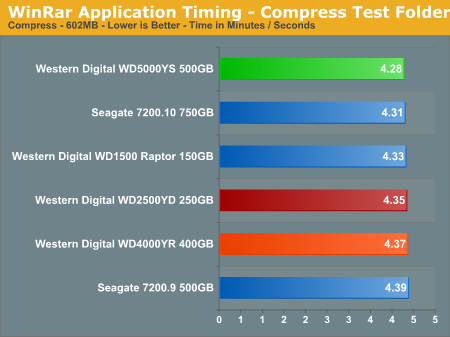
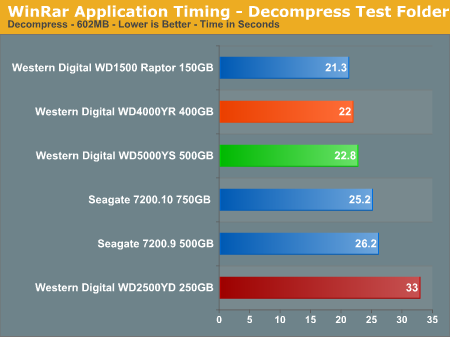
The compression tests mimic our iPEAK results with the WD RE2 500GB drive having the top score, followed by the Seagate 7200.10 unit. While the WD2500YD was competitive in the file compression tests and even bested the RE2 400GB drive, the performance in the decompression test is abysmal finishing twelve seconds behind the Raptor and seven seconds behind the Seagate 500GB drive. Upon noticing this result, we generated several other compress/decompress test scenarios with the same basic results.
AnyDVD 5.9.6
Our next test has us utilizing the "ripping" function of AnyDVD to copy the Office Space DVD file from our source drive to our test drive. Our DVD features 29 files totaling 7.55GB of data and is an excellent test for determining the write speed of a drive.
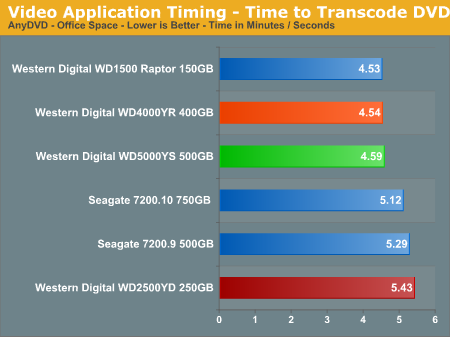
The test results show what we all know: speed kills. In this case, the WD Raptor posts yet another first place score but is followed very closely by the RE2 drives. The WD2500YD finishes up to 50 seconds behind the top WD drives in this test. If you spend a lot time converting your movie collection or generating video files then buying the fastest drive you can afford can lead to a significant time savings.
Nero Audio Encode
Our last test has us utilizing the audio encoding functions of Nero to convert our INXS Greatest Hits audio files from MP4 format to a high quality variable rate MP3 file for our portable player. Our benchmark features 16 files totaling 137MB of data and is an excellent test for determining the read and write speed of a drive.
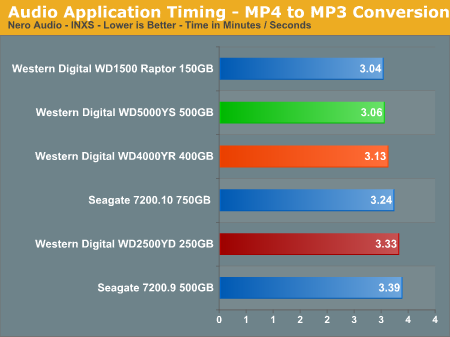
The test results show once again the amount of time a fast hard drive like the WD Raptor can save over the course of audio or video file manipulation session. The two RE2 drives are close behind the Raptor with the WD2500YD finishing near last again, although the difference is substantially less than in the video tests.
Acoustics
We have revised our acoustics testing methodology. Our acoustic test utilizes our standard test bed components but we implement AMD's Cool'n'Quiet technology and turn off the case fans to isolate as much case noise as possible during testing. Our OCZ power supply is virtually silent in these tests along with our fanless Asus 7600GS video card providing a further decrease in our case's acoustical ambience.
Our acoustic tests are designed to measure the decibel levels while the system is at idle and also under load while running the General Hard Disk Drive Usage benchmark within PCMark 2005. We found through trail and error this particular benchmark produces controlled readings across a wide range of applications within the benchmark. This particular benchmark utilizes 60% reads and 40% writes within the trace playback file.
The measurements are taken at a distance of 5 millimeters from the rear and front of the drive being tested in order to minimize surrounding environmental noise. The reported measurements are based on an A-weighted decibel score that measures frequencies similar to the way the human ear responds to sound. We take a total of three measurements for each test. We then subtract the high and low scores and arrive at our findings by reporting the remaining score.
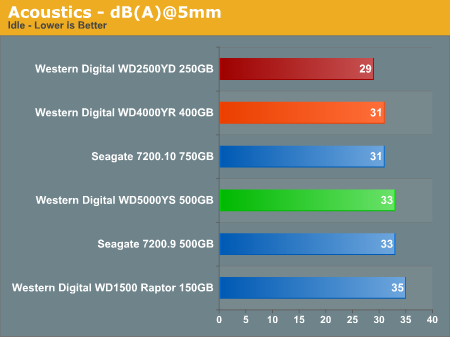
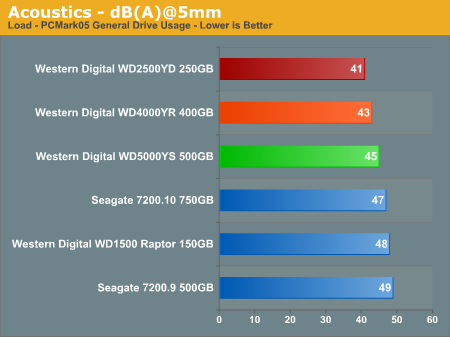
The WD2500YD is one of the quietest drives we have ever tested. In fact, the current RE and RE2 lineup are very quiet at idle and while under load. Our subjective opinion is that the seek requests are very muted for this drive and it was difficult to notice the drive's noise levels over the power supply fan during most read/write operations. We did notice a slight thumping noise in our Nero Recode benchmark that would occur during continuous data streaming. Our base db(A) level in the room at time of testing was 24 db(A).
Thermals
Our thermal tests utilize sensor readings via the S.M.A.R.T. (Self-Monitoring, Analysis and Reporting Technology) capability of the drives and are reported by utilizing the Active SMART 2.42 utility. We test our drives in an enclosed case environment without the front fan operational to simulate temperatures that could conceivably be reached in a SFF or HTPC case design. We typically find the reported numbers drop anywhere from 18% to 25% on average when the front fan is operational.
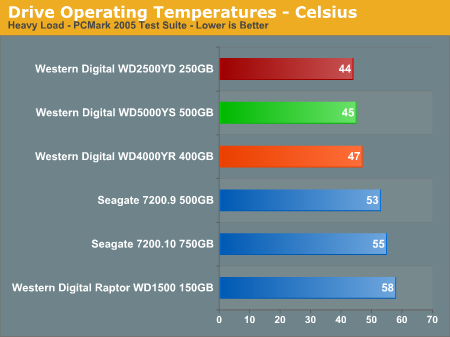
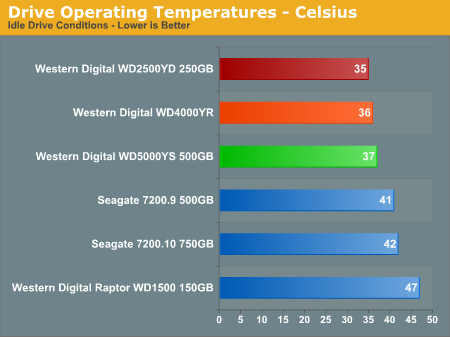
We expected the WD2500YD to run cool due to its size and platter count. It did not disappoint us in either test as even the casing remained cool to the touch after hours of continuous testing. Remember that these results represent something of a worst-case scenario, as they are recorded in an enclosed Gigabyte case without the front fan operating. If you plan on using a quiet/poorly ventilated inflated case, you'll want to pay attention to these results.
Both the RE2 drives also ran very cool, but the casings were significantly warmer after continuous operation compared to the RE 250GB drive. Our room temperature at time of testing remained a stable 21C. The WD Raptor and the Seagate drives operated at significantly higher temperatures, although both are within their operating specifications. It is unlikely that higher temperatures would immediately cause a drive failure, but they can reduce the lifespan of a hard drive. We highly recommend cooling the hotter drives with a fan or by some other means.
Final Words
The performance of the new Western Digital RE16 series on the desktop is certainly competitive with the other desktop units in our tests. This does not come as a surprise given the recent improvements in the drive design and firmware compared to the previous generation product. However, it is obvious that when comparing the WD2500YD to its performance oriented and Raptor technology based RE2 counterparts that Western Digital is correct in marketing this drive as an entry level nearline enterprise product. This is not a knock against the drive; it's just that the RE2 and Raptor perform significantly better in most of the benchmarks, as they should.
While the drives are specifically designed for RAID server applications such as video surveillance, enterprise backup, document management, scientific computing, and audio/video applications, we found the drive to be at home on the desktop in a single drive configuration as well. The overall performance results as a single drive were very good, and in our preliminary RAID testing (we'll cover this more in our next article) it excels considering a price of $.33 per gigabyte. As the RE2 WD5000YS currently costs $.51 per gigabyte and the RE2 WD4000YR costs $.43 per gigabyte, the WD2500YD is a bargain in its price class.
Throughout our intensive test schedule that has netted over 220 hours of drive testing, we did not find or experience any quality issues with this drive. While we did not experience any TLER related errors in our non-RAID tests, the possibility exists that a recoverable error could be marked as unrecoverable. However, we feel like if an error is not recovered within seven seconds then it probably is a true error and should be marked as such. It is still Western Digital's recommendation that you purchase the SE16 drive for general desktop usage although we find the RE16 to be a better overall value from a feature viewpoint. We will see shortly if it is also a better choice from a performance perspective.
We found this drive to be one of the quietest drives we have tested and found the seek requests to be very muted and generally unobtrusive during our testing with a near silent system. Once we turned on the case fans, the drive could not be heard. The drive runs surprisingly cool without air circulation around it and even cooler with it. We would not hesitate to operate this drive on a 24/7 basis in an HTPC or SFF case.
What is our recommendation? If the storage capacity of this drive is acceptable and you need an extremely reliable drive for your SFF setup then this drive offers the features and performance you need. If want to run two or more of these drives in a RAID 0/1 or higher array in an HTPC application then it would be a perfect fit considering the low cost of the drive matched with 24/7 operation capability. Overall, the WD2500YD drive is a very good effort from Western Digital. We will see how it matches up to the direct competition in the near future.


