Original Link: https://www.anandtech.com/show/1881
Hitachi vs. Western Digital vs. Seagate: A Battle of the Mammoths
by Purav Sanghani on December 2, 2005 12:05 AM EST- Posted in
- Storage
Introduction
When Hitachi first introduced their 500GB hard disk drives, we thought that it would take forever for them to actually begin manufacturing the units, which was not the case. We gave Hitachi the credit for being the first manufacturer to put out the largest hard disk drive ever, but we couldn’t really gauge its performance, since there were really no other drives to which to compare it.
Last month, Seagate officially announced their 7200.9 line of desktop hard disk drives and we had a chance to look at their largest unit in the line, the 500GB Barracuda. During our tech briefing with the 7200.9 product manager, we learned that the line was the end result of combining the two previous lines, the 7200.7 and the 7200.8. The joining of forces led to the 7200.9 name and included all of the capacities from the previous two.
Again, we could not really compare Seagate’s 500GB unit with any of the other drives that we had benchmarked and so, we were determined to get our hands on the largest units on the market today. Hitachi and Seagate were held to have the largest capacities at 500GB and we threw in Western Digital’s 400GB unit for kicks.
Here’s how the drives weigh in…
| Capacity | Platter Density | # of Platters / Heads | Spindle speed (RPM) | Average Seek Time | Average Latency | Interface | Buffer Sizes | |
| Hitachi 7K500 | 500GB | 100GB | 5 / 10 | 7200 | 8.5ms | 4.17ms | PATA / SATA 3.0Gb/sec | 16MB |
| Seagate 7200.9 500GB | 500GB | 125GB | 4 / 8 | 7200 | 8.5ms | 4.16ms | PATA / SATA 3.0Gb/sec | 16MB |
| Western Digital WD4000YR | 400GB | 100GB | 4 / 8 | 7200 | 8.7ms | 4.2ms | PATA / SATA 1.5Gb/sec | 16MB |
The WD4000YR is only a 1.5 Gb/sec drive, but we’re including it to compare performance between it and the newer 3.0 Gb/sec units. And since it is Western Digital’s new high capacity model, we thought, why not take a peek at its performance as well and to see which drive gives us more bang for the buck.
The Test
Our test bed specs have been laid out below. We used Western Digital's 160GB 3.0 Gb/sec drive, since it was the quickest in our 3-way SATA 3.0Gb/sec Shootout.
Our test bed:
AMD Athlon 64 3500+ (2.2Ghz)
Giga-byte GA-K8NXP-SLI
Western Digital WD1600JS
NVIDIA 6600GT SLI Edition (single 128MB card )
1GB (512MBx2) Corsair XMS4400
Our motherboard is an nForce4 based board, which features support for the SATA II standard, up to 3.0 Gb/sec SATA transfer rates, and NCQ and TCQ.
We used the following nForce platform drivers in conjunction with our testbed:
nForce4 Chipset Driver 6.66
NVIDIA graphics driver 71.89
Windows XP SP2 w/out further updates
| AnandTech Storage Tests | |
| Business Winstone IPEAK | a playback test of all of the IO operations that occur within Business Winstone 2004 |
| Content Creation IPEAK | a playback test of all of the IO operations that occur within Multimedia Content Creation Winstone 2004 |
| Half-Life 2 Level Load Test | Half-Life 2 level load time test |
| Doom 3 Level Load Test | Doom 3 level load time test |
| Command & Conquer: Generals Level Load Test | Command & Conquer: Generals level load time test |
| Real World File System Task Tests | timed tests of basic file system tasks including zipping/unzipping and copying files |
| HDTach | Synthetic test for transfer rate of hard disk during a full disk read |
| Service Time and Transfer Rate Tests | Synthetic tests for average service time and transfer rate of hard disk during a full disk read |
| Business Winstone 2004 Multitasking Test | Synthetic tests for overall system multitasking performance |
| Real World Multitasking Test | timed tests of basic multitasking processes, timing a file zip operation while importing Outlook data |
More details about each individual test will appear in the section of the review dedicated to that particular test.
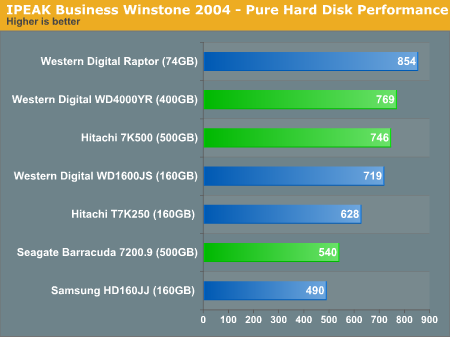
Pure Hard Disk Performance - IPEAK
We begin our usual hard disk drive test session with Intel's IPEAK benchmarking utility. We first run a trace capture on Winstone 2004's Business and Multimedia Content Creation benchmark runs to catch all of the IO operations that take place during each test. We then play back each capture using RankDisk, which reports back to us a mean service time, or average time that the drive takes to complete an IO operation.
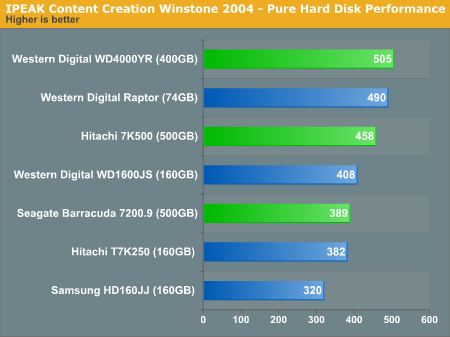
Let's take a look at Content Creation performance.
WinBench 99 - Transfer Rate Test
We ran WinBench 99's Disk Transfer Rate Test to get a better measure of just how well the transfer rates are over the course of the entire disk. The Disk Transfer Rate test reads from the media in a linear fashion from the beginning (first track) to the end (last track). The numbers below represent the ceiling and floor of the transfer rates throughout the test.
![]()
Click to enlarge.
![]()
Click to enlarge.
![]()
Click to enlarge.
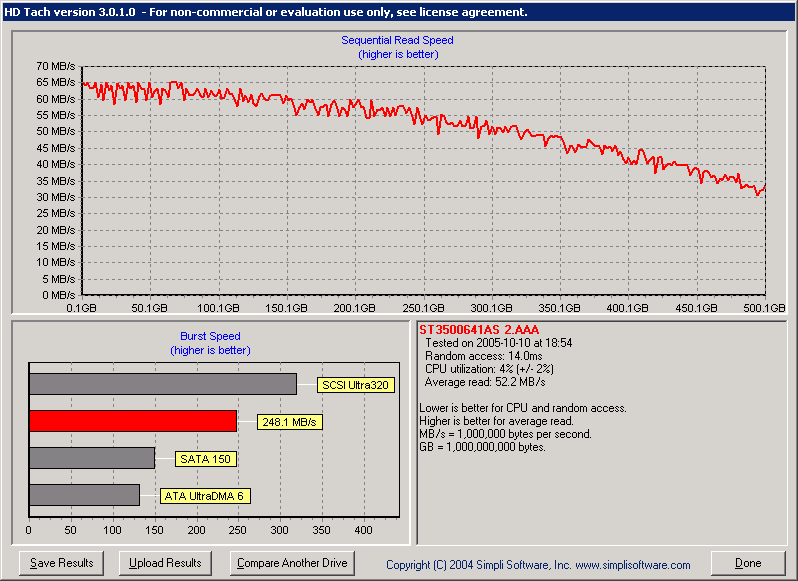
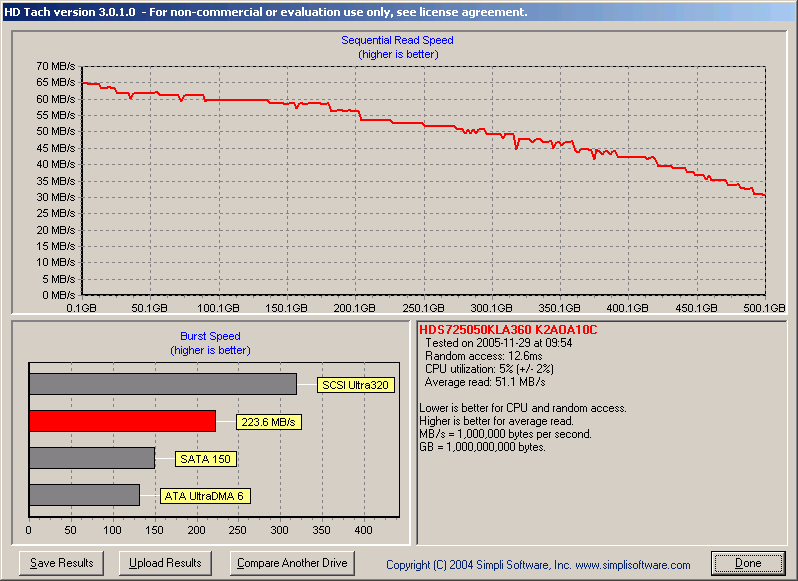
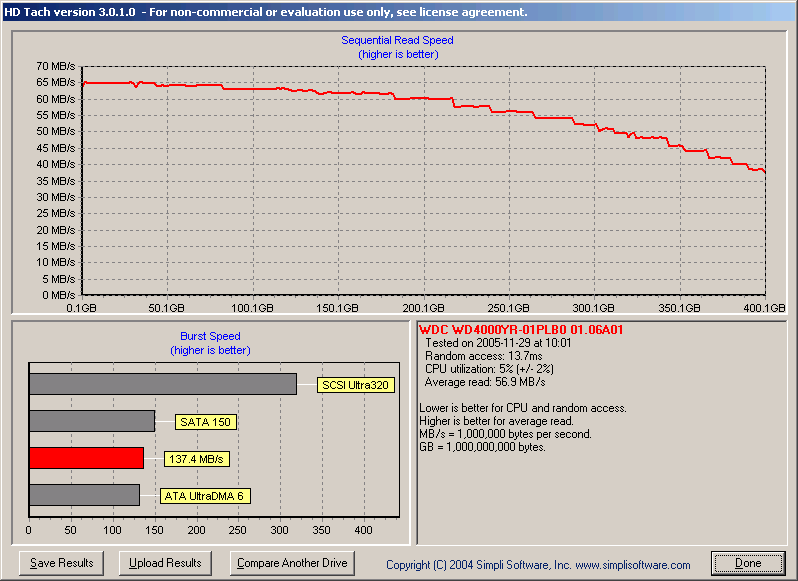
HDTach - Sequential Read Speed/Burst Speed
The HDTach benchmark gives us a great deal of detail on the performance of a hard drive. Like the WinBench 99 Transfer Rate test, HDTach graphs the sequential read speed of the drive as the drive reads continuously from beginning to end.
Click to enlarge.
Click to enlarge.
Click to enlarge.
Windows Read Speed Test
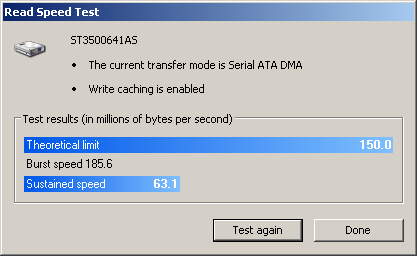
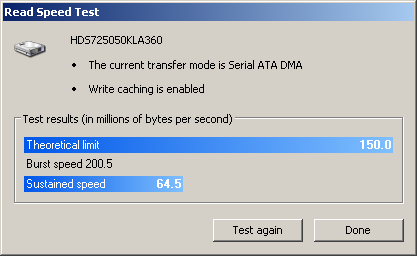
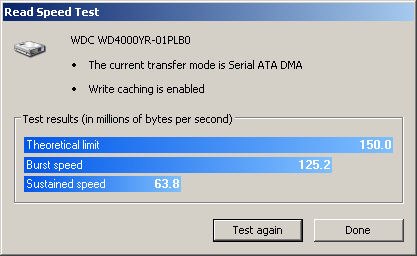
It seems the Windows Read Speed Test gives us a better readout of the actual transfer rates of each drive. We see that the Seagate and Hitachi read speeds are off the charts because of their 3.0Gb/sec maximum transfer rate. The WD4000YR is a 1.5Gb/sec drive which is why the transfer rate is much lower than the 7K500's 200MB/sec+ rate.
Real World Tests
Synthetic benchmarks are not always the best gauge in measuring the "real" performance of hardware, which is why we have incorporated a few real world tests in our storage reviews. One of our tests, the file system performance test, measures the drive's ability to handle file zip, unzip, and copy operations. This is a great measure of how one drive compares to another and we have put together a group of tasks that most of us typically use.
File System Tasks Within Drive
- File Zip Test - We take a 300MB file and measure the time that it takes for our test bed to compress it to ZIP format. We then run the test again with 300 1MB files to see how the drive performs when working with multiple files.
- File Unzip Test - Using the same methodology as the File Zip Test, we take a ZIP file of a single 300MB file as well as a ZIP file of 300 1MB files and measure the time that it takes to uncompress each ZIP successfully.
- File Copy Test - We measure how long it takes for the system with our test drive to copy a single 300MB file as well as 300 1MB files.
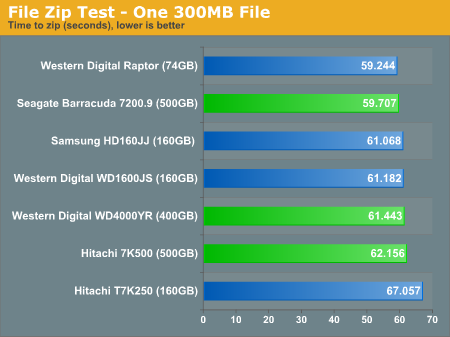
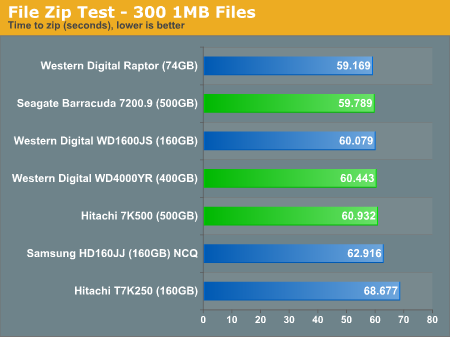
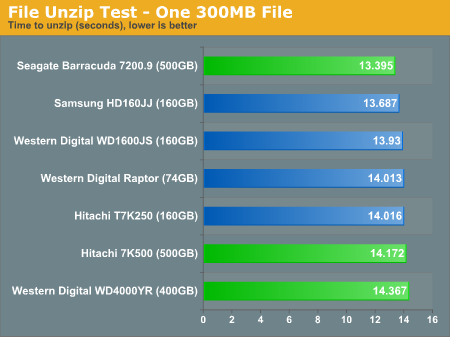
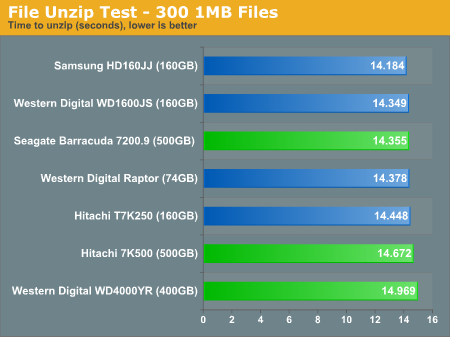
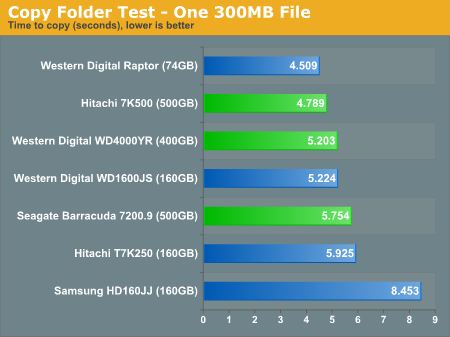
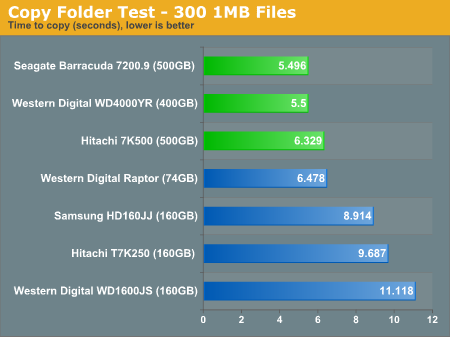
The File Zip/Unzip tests are more dependent on the CPU than the File Copy tests which is why we see the extremely close results. The File Copy test shows Hitachi's 7K500 performing slightly quicker than the Seagate and Western Digital drives.
Real World Tests - Multitasking Performance
To provide a real world example of multitasking, we run Outlook and import 450MB of emails into an account. We then measure the time that it takes our benchmarking utility to zip a single 300MB file. To compare our results, we calculate the difference between the multitasked process and the single task file zip process.
| Outlook + Zip a 300MB File Within Drive | |||
| Multitasked | File Zip Only | % Difference | |
| Seagate 7200.9 500GB, 16MB, 3.0GB/sec | 69.215 | 59.707 | 15.9% |
| Hitachi 7K500, 16MB, 3.0GB/sec | 70.512 | 62.156 | 13.4% |
| Western Digital WD1600JS | 69.25 | 61.443 | 12.7% |
The WD4000YR looks like it performs the best out of the three while running multiple tasks but only by a second or two. It zips a 300MB file while importing emails in Outlook about 12.7% slower than just performing the file zip operation on its own while the Hitachi and Seagate drives handle this task 13.4-15.9% slower.
Real World Tests - Application Load Times
In our Application Load Time tests, we measure the time that it takes for each application to startup. For example, our benchmarking tool begins the stopwatch as soon as PhotoShopCS.exe is run, and stops after the application has finished loading all of the plug-ins and filters and shuts down. We take the average of three runs with system reboots and hard disk defragmentations before each test run.
| Application Load Times (average, seconds) | |||||
| PhotoShop CS | Word 2003 | Excel 2003 | Access 2003 | PowerPoint 2003 | |
| Seagate 7200.9 500GB, 16MB, 3.0GB/sec | 8.024 | 2.109 | 2.109 | 2.213 | 2.203 |
| Hitachi 7K500, 16MB, 3.0GB/sec | 7.413 | 1.703 | 1.986 | 1.765 | 1.828 |
| Western Digital WD4000YR, 16MB 1.5GB/sec | 7.232 | 1.687 | 1.718 | 1.640 | 1.593 |
The WD4000YR takes the lead here as well, opening up each of the test applications slightly quicker than the other two drives. The numbers are close, but consistent enough for us to use in determining the best performing product.
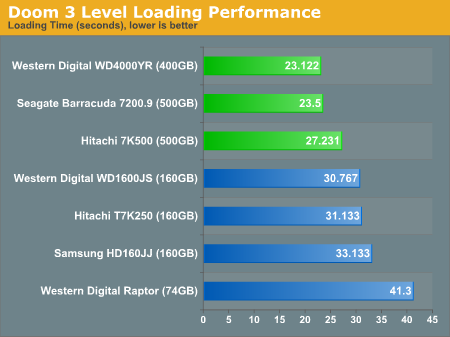
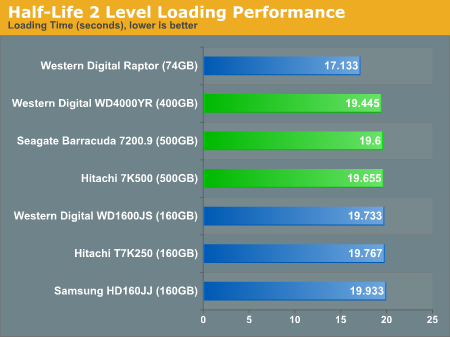
Real World Tests - Game Level Load Times
Our Game Level Loading Time tests include two of the latest games: Doom 3 and Half-Life 2. Because of their high resolution textures and the large levels, the loading time for the levels of each game are long enough to help show a difference between each drive.
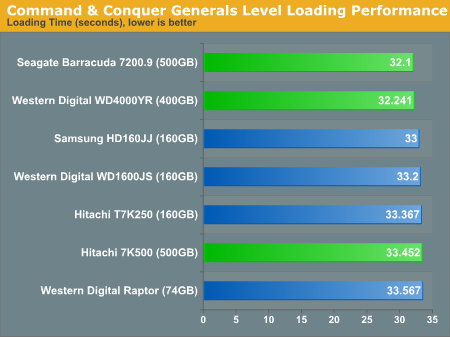
We have also included an older strategy game, Command & Conquer: Generals, because of its longer level load times as well. Though the game is a couple of years old, it still proves to be a good measure of data loading performance.
Thermal and Acoustics
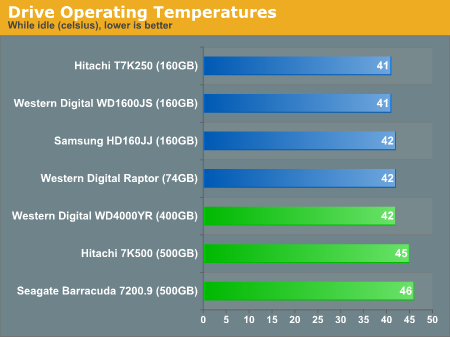
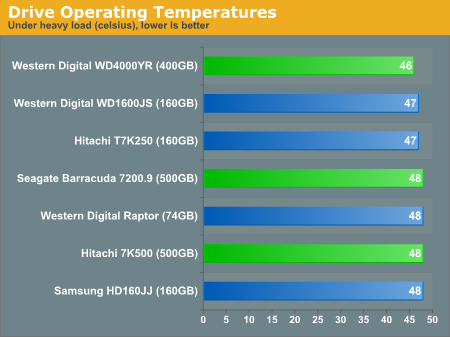
Heat and sound are also two very important factors in drive performance especially when considering where they will be used. A loud hard drive that becomes warm very quickly may not be the best choice for home theater PCs or any PC without adequate cooling, and the noise alone could be a bit annoying. Take a look at how each drive performed as far as heat and noise output goes.
Thermal
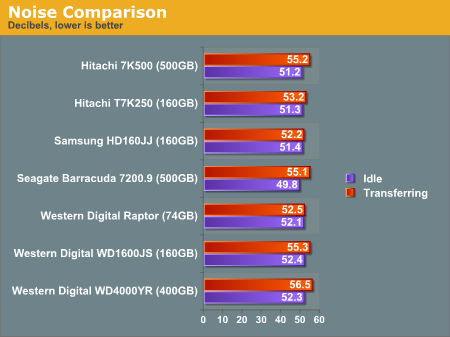
Acoustics
To measure the sound output of each drive, we have taken decibel readings of each drive 1" away from the side at their startup phase as well as the sound output while there is disk activity.
Final Words
What we've learned is that even though two of the three drives that we reviewed today have 3.0 Gb/sec SATA interfaces, the 1.5Gb/sec drive topped both of them in most of the benchmarks. We had to run a few of our benchmarks multiple times just to prove to ourselves that the numbers were correct and nothing was interfering with the accuracy of our results.
Beginning with the IPEAK runs, the WD4000YR took the lead performing 769 IO operations per second under the Business Winstone 2004 test and 505 IO operations per second in the Content Creation Winstone 2004 part of the test. Seagate's 500GB 7200.9 came nowhere close to these numbers, but rather took a few steps back.
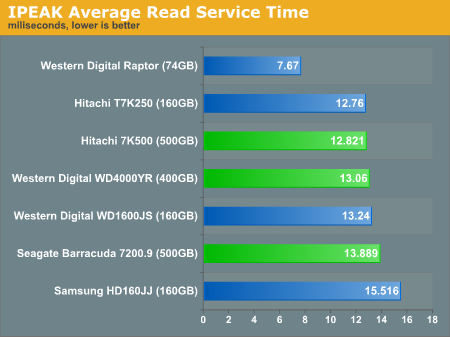
The WD4000YR also performed the best out of the three in the application load time tests with applications starting at around half a second faster consistently, which is a big deal. With this test, we were not only testing the specified application load times, but also general access times and service times.
All of the physical specifications of the WD4000YR tell us that it won't perform as well as the two 500GB models, but our benchmark results say otherwise. Those of us who are familiar with hard drive technology know that the higher transfer rates that the 3.0Gb/sec models have to offer can only be achieved when multiple disks are striped, but we never thought that a 1.5Gb/sec unit could out-do those with double the theoretical transfer rates.
Currently, the WD4000YR is going for as low as $213 at certain online retailers while the Seagate 500GB 7200.9 and Hitachi 7K500 are going for $350-$400. If you're not looking for a future-proof product and want quick performance for a low price, the WD4000YR is the way to go. The performance of the 7200.9 is just not up to par to recommend at the moment. It may quite possibly give much better performance in a RAID array, but that we'll leave for another day.


