Original Link: https://www.anandtech.com/show/10404/asrock-deskmini-110-ministx-pc-review
ASRock DeskMini 110 mini-STX PC Review
by Ganesh T S on June 8, 2016 8:45 AM EST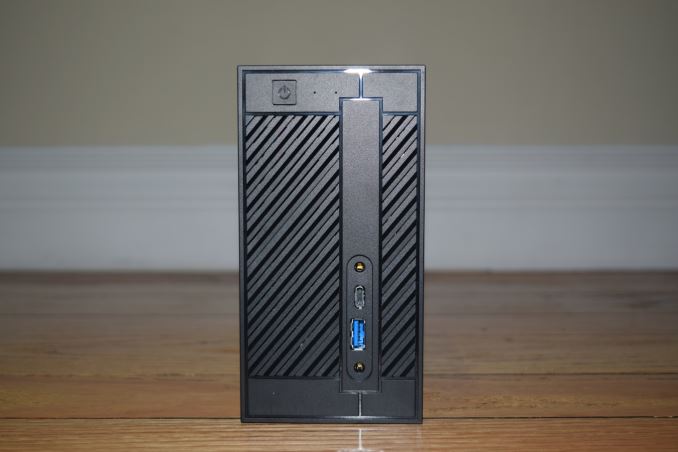
Intel introduced the 5x5 mini-STX form factor late last year with the aim of creating a small form-factor PC between that of a NUC and a mini-ITX build. Compared to the NUC-type machines, the mini-STX allow the end-user to choose a CPU appropriate for the budget and requirements. We have already looked at mini-STX offerings from ECS and MSI before, but, their computing power was restricted by the use of low-power T-series (35W TDP) CPUs. ASRock's first mini-STX machine, the DeskMini, is the first mini-STX system to have full support for 65W CPUs along with a stock Intel cooler. The DeskMini is quite affordable - $130 gives the end user a chassis, H110 motherboard and a power adapter.
Introduction and Setup Impressions
ASRock is no stranger to mini-PCs. Their Vision series (using custom mobile processor-based motherboards with an optional discrete mobile GPU), larger than the NUCs, but smaller than a mini-ITX build, have proved to be quite popular in the small form-factor market. The DeskMini is ASRock's play in the mini-STX field. Like all other current mini-STX machines, the DeskMini board comes with a LGA 1151 socket. However, the chassis is large enough to support a stock Intel CPU cooler. This means that the unit can support CPUs with TDPs up to 65W. The two SODIMM slots are of the DDR4 variety (like the MSI Cubi 2 Plus, and unlike the ECS LIVA One).
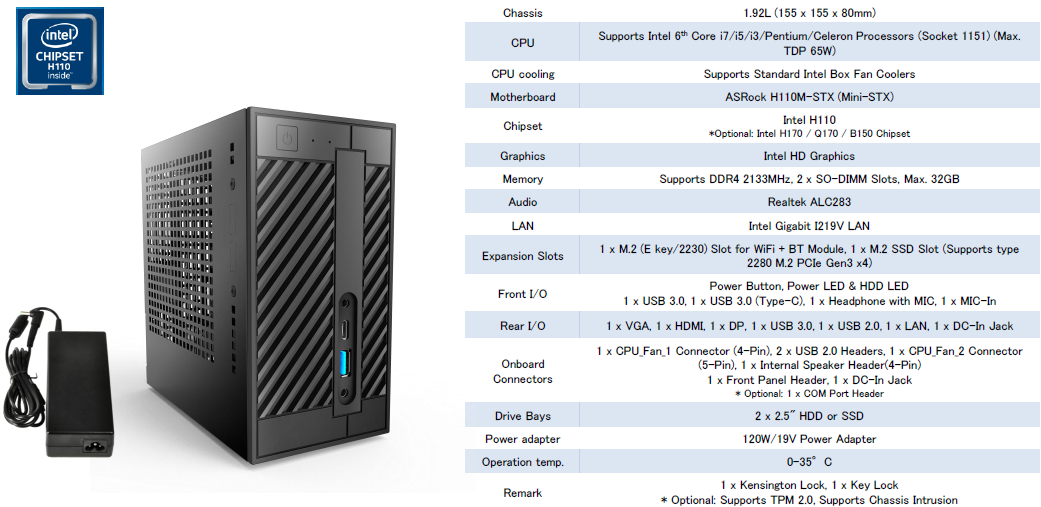
The other interesting aspect is the M.2 SSD slot - usually, vendors want to maintain both SATA and PCIe support, but ASRock has decided to support only PCIe SSDs - this means that the I/O lanes feeding the slot are not multiplexed from the H110 PCH, but, come from the CPU directly. The H110 chipset used in the DeskMini is one of the lower-end 100-series chipsets. The PCIe lanes from the PCH are PCIe 2.0 and the I/O options are limited. Therefore, it is a point of differentiation for ASRock to utilize the CPU's PCIe lanes for the M.2 SSD slot.
Other than the 65W TDP CPU support and the PCIe 3.0 M.2 SSD slot, other aspects are similar to currently available mini-STX machines - support for 2.5" drives, and flexibility to add serial ports / extra USB ports with tweaks to the connectors / using a slightly different chassis.
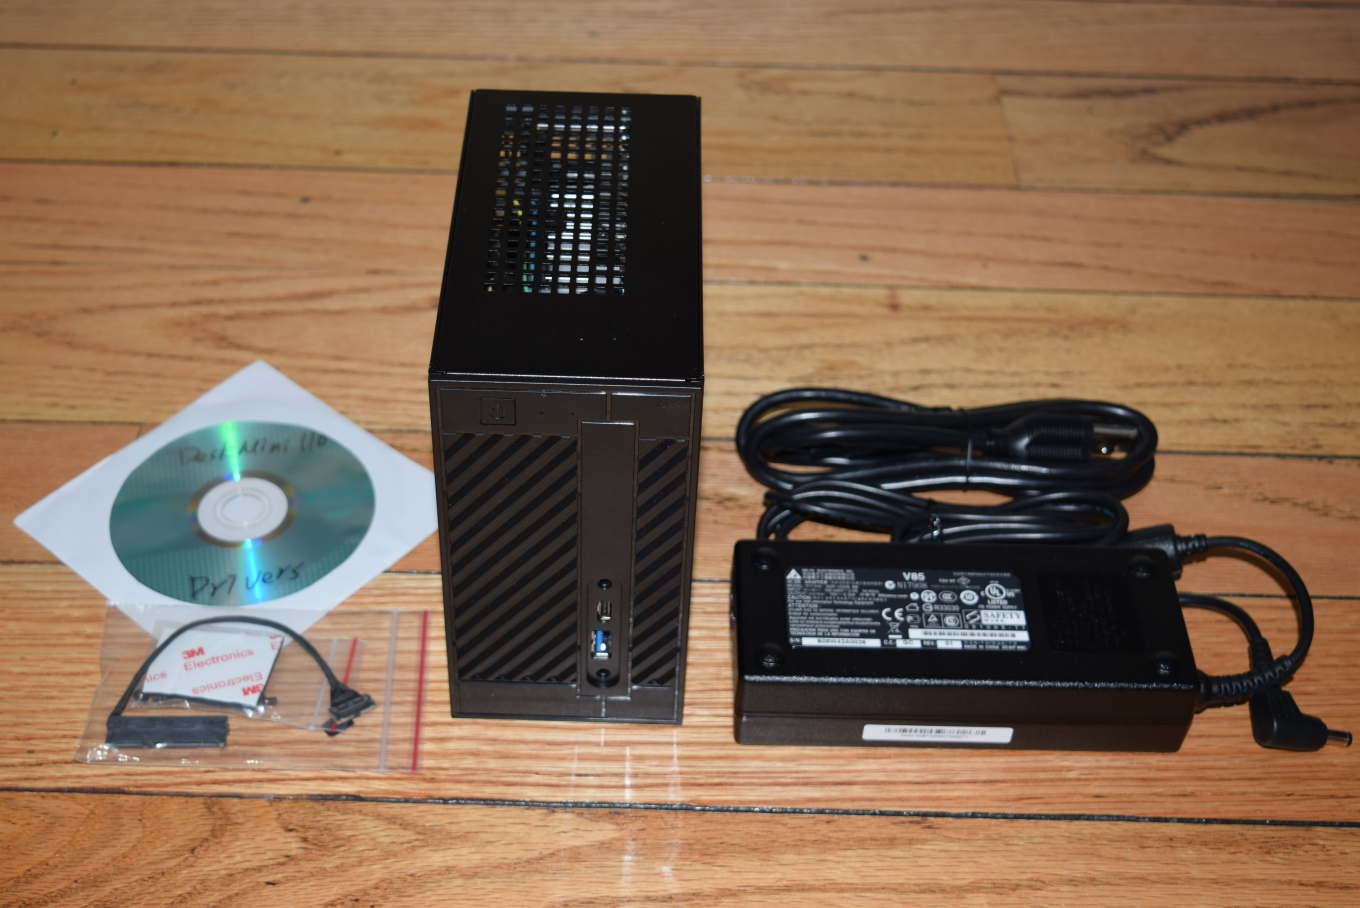
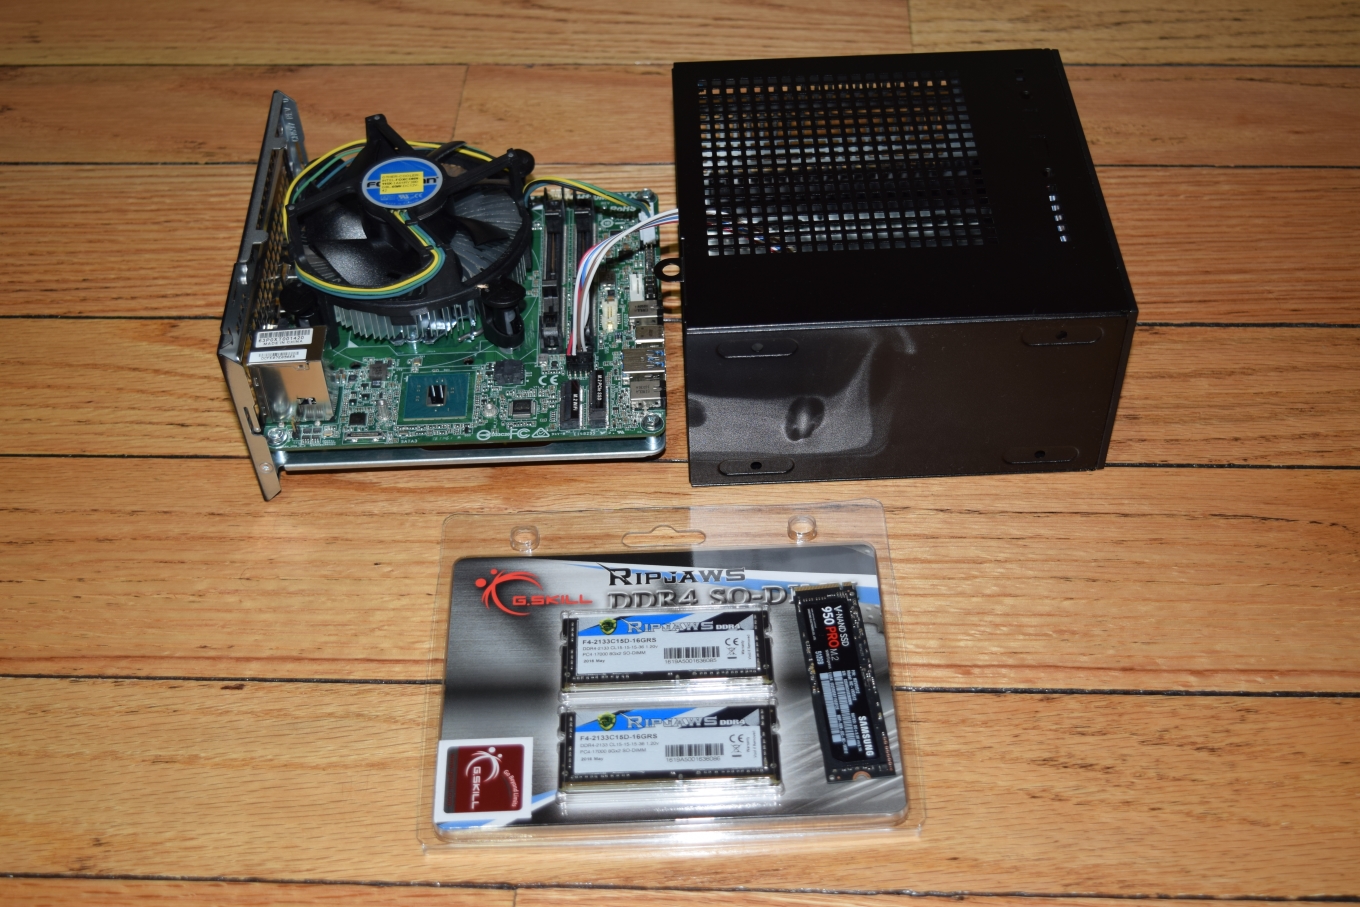
ASRock sent across an unusual set of components for the build. A Core i5-6500 and a G.Skill DDR4 2133 MHz 2x8GB kit were included in the package in addition to the main kit (chassis with the motherboard pre-installed, a 120W (19V @ 6.32A) power adapter and appropriate power cord). However, the M.2 WLAN adapter slot was empty. We reached out to Intel for the AC8260 PCIe card, and used a Samsung SSD 950 PRO in order to complete the build.
The specifications of our review sample are summarized in the table below.
| ASRock DeskMini 110 Specifications | |
| Processor | Intel Core i5-6500 Skylake x86_64, 4C/4T, 3.2 GHz (3.6GHz), 14nm, 6MB L2, 65W |
| Memory | G Skill F4-2133C15-8GRS DDR4 15-15-15-36 @ 2133 MHz 2x8 GB |
| Graphics | Intel HD Graphics 530 |
| Disk Drive(s) | Samsung SSD 950 PRO (512 GB; M.2 Type 2280 PCIe 3.0 x4 NVMe; 40nm; MLC V-NAND) |
| Networking | Intel Dual Band Wireless-AC 8260 (2x2 802.11ac - 866 Mbps) Intel I219-V Gigabit Wired Ethernet |
| Audio | 3.5mm Headphone Jack Capable of 5.1/7.1 digital output with HD audio bitstreaming (HDMI) |
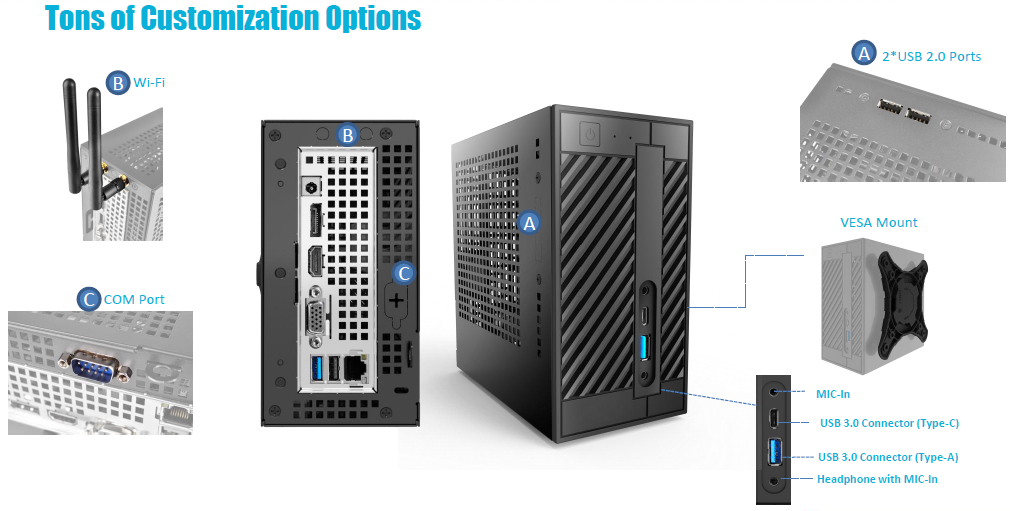
| Miscellaneous I/O Ports | 1x USB 2.0 2x USB 3.0 Type-A, 1x USB 3.1 Gen 1 Type-C |
| Operating System | Retail unit is barebones, but we installed Windows 10 Pro x64 |
| Pricing (As configured) | $739 ($130 for barebones chassis, motherboard, power adapter) |
The gallery below takes us around the chassis and the internals of the DeskMini, as well as the Intel WLAN adapter.


The BIOS is one of the more comprehensive ones that we have seen in the mini-STX space. The gallery below shows the various tweaks available.


In the table below, we have an overview of the various systems that we are comparing the DeskMini against. Note that they may not belong to the same market segment. The relevant configuration details of the machines are provided so that readers have an understanding of why some benchmark numbers are skewed for or against the DeskMini when we come to those sections.
| Comparative PC Configurations | ||
| Aspect | ASRock DeskMini 110 | |
| CPU | Intel Core i5-6500 | Intel Core i5-6500 |
| GPU | Intel HD Graphics 530 | Intel HD Graphics 530 |
| RAM | G Skill F4-2133C15-8GRS DDR4 15-15-15-36 @ 2133 MHz 2x8 GB |
G Skill F4-2133C15-8GRS DDR4 15-15-15-36 @ 2133 MHz 2x8 GB |
| Storage | Samsung SSD 950 PRO (512 GB; M.2 Type 2280 PCIe 3.0 x4 NVMe; 40nm; MLC V-NAND) |
Samsung SSD 950 PRO (512 GB; M.2 Type 2280 PCIe 3.0 x4 NVMe; 40nm; MLC V-NAND) |
| Wi-Fi | Intel Dual Band Wireless-AC 8260 (2x2 802.11ac - 866 Mbps) |
Intel Dual Band Wireless-AC 8260 (2x2 802.11ac - 866 Mbps) |
| Price (in USD, when built) | $739 | $739 |
Performance Metrics - I
The ASRock DeskMini 110 was evaluated using our standard test suite for small form-factor PCs. Not all benchmarks were processed on all the machines due to updates in our testing procedures. Therefore, the list of PCs in each graph might not be the same. In the first section, we will be looking at SYSmark 2014, as well as some of the Futuremark benchmarks.
BAPCo SYSmark 2014
BAPCo's SYSmark 2014 is an application-based benchmark that uses real-world applications to replay usage patterns of business users in the areas of office productivity, media creation and data/financial analysis. Scores are meant to be compared against a reference desktop (HP ProDesk 600 G1 with a Core i3-4130, 4GB RAM and a 500GB hard drive) that scores 1000 in each of the scenarios. A score of, say, 2000, would imply that the system under test is twice as fast as the reference system.
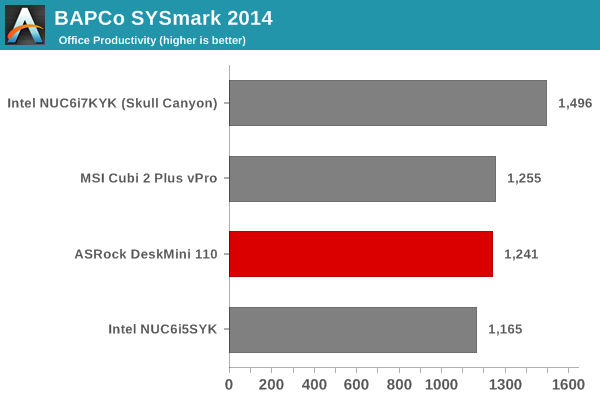
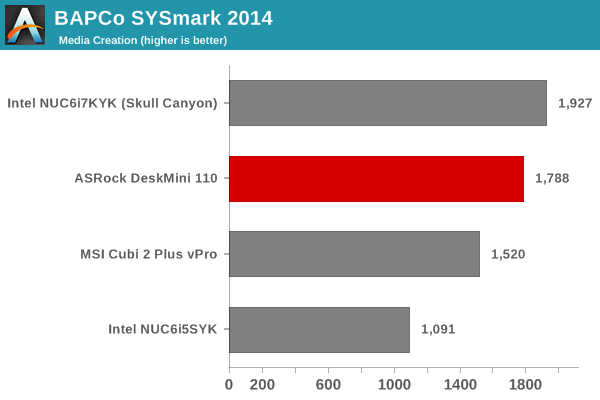
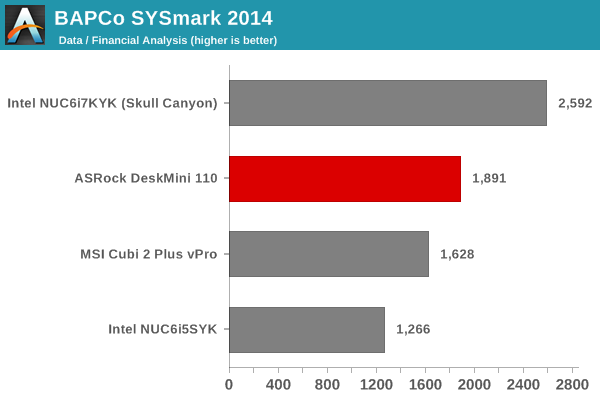
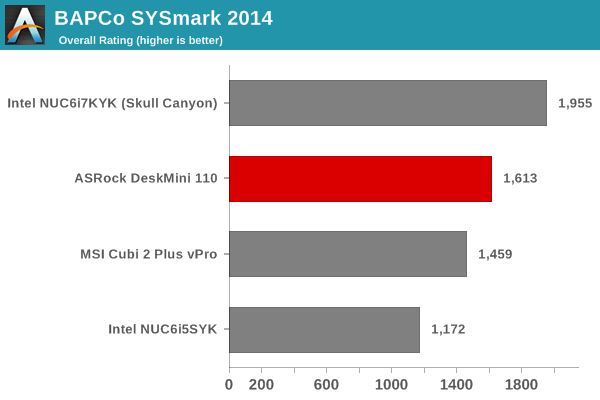
SYSmark scores are heavily dependent on the CPU in the system. Here, we see the 65W TDP Core i5-6500 come behind the 45W TDP Core i7-6770HQ, primarily due to the hyperthreading (4C/8T) features of the latter. Note that the Core i5-6500 is a 4C/4T CPU. Other than that, the DeskMini that we built has no trouble proving to be better at business workloads compared to systems equipped with lower TDP CPUs.
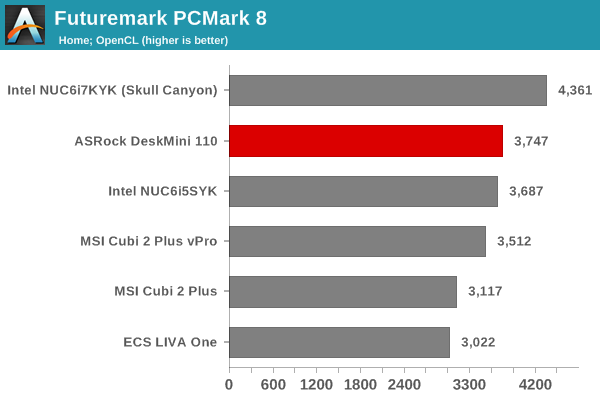
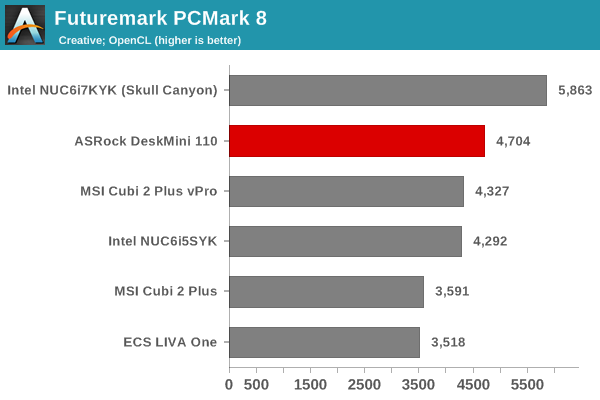
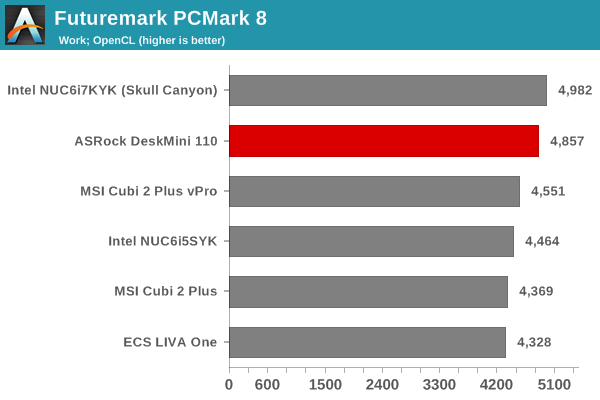
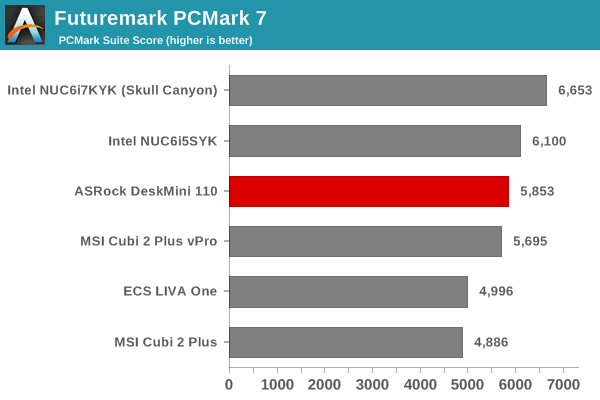
Futuremark PCMark 8
PCMark 8 provides various usage scenarios (home, creative and work) and offers ways to benchmark both baseline (CPU-only) as well as OpenCL accelerated (CPU + GPU) performance. We benchmarked select PCs for the OpenCL accelerated performance in all three usage scenarios. These scores are heavily influenced by the CPU in the system. The aspects noted in the SYSmark 2014 subsection apply here too. The DeskMini comes second to Skull Canyon, but has no trouble being better than the other systems in the comparison list.
Miscellaneous Futuremark Benchmarks
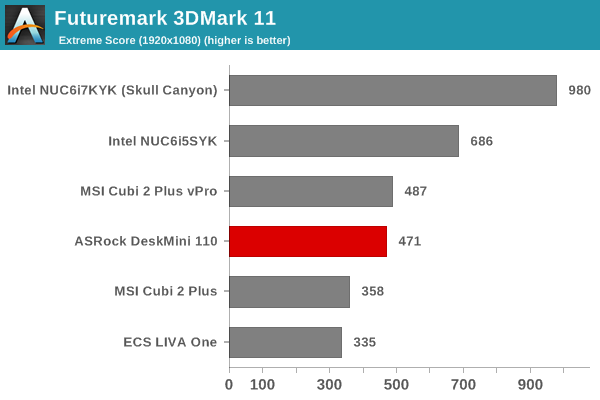
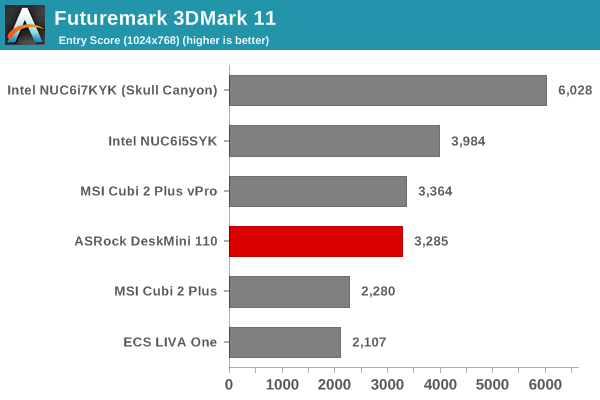
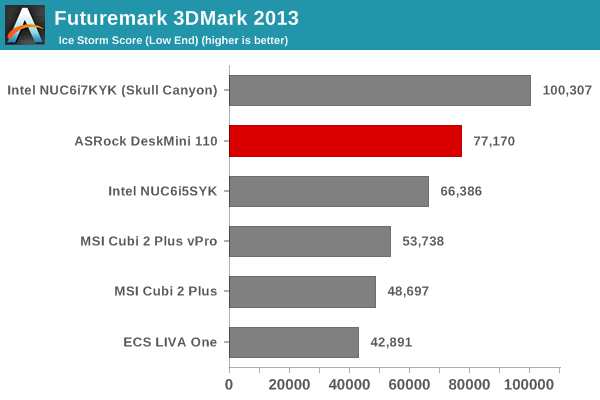
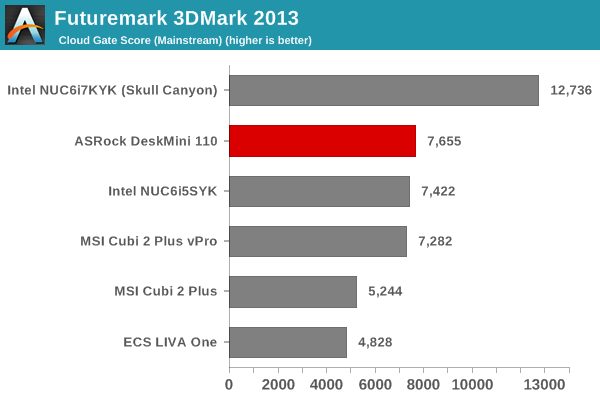
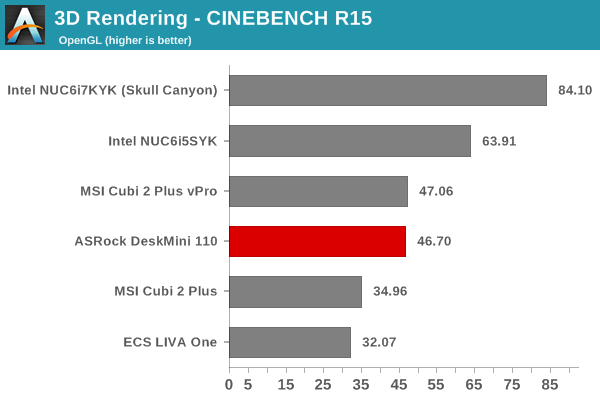
The 3D benchmarks present a different story, because the HD Graphics 530 is not as powerful as the GPUs in either Skull Canyon (Iris Pro with eDRAM) or even the U-series models for many workloads.
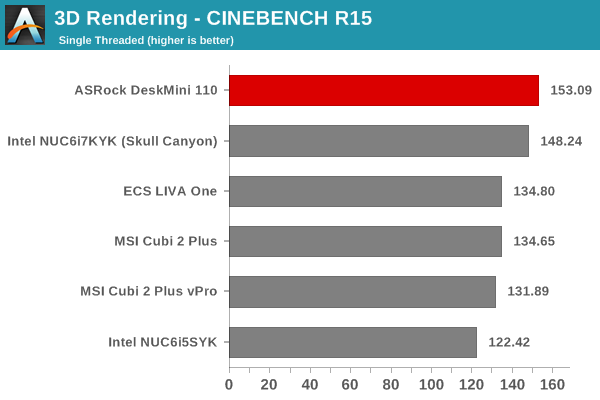
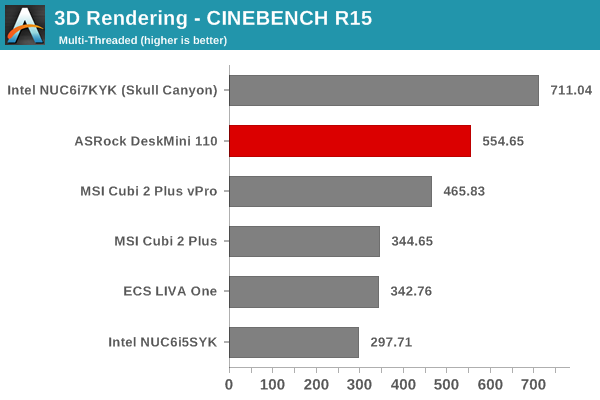
3D Rendering - CINEBENCH R15
We have moved on from R11.5 to R15 for 3D rendering evaluation. CINEBENCH R15 provides three benchmark modes - OpenGL, single threaded and multi-threaded. Evaluation of select PCs in all three modes provided us the following results. The Core i5-6500's single threaded performance is top of the line, thanks to the high TDP / clock speed. However, absence of hyperthreading allows Skull Canyon (Core i7-6770HQ) to sneak ahead in the multi-threaded case. The OpenGL results lend further credence to the analysis of the GPU capabilities made in the previous subsection.
Performance Metrics - II
In this section, we mainly look at benchmark modes in programs used on a day-to-day basis, i.e, application performance and not synthetic workloads.
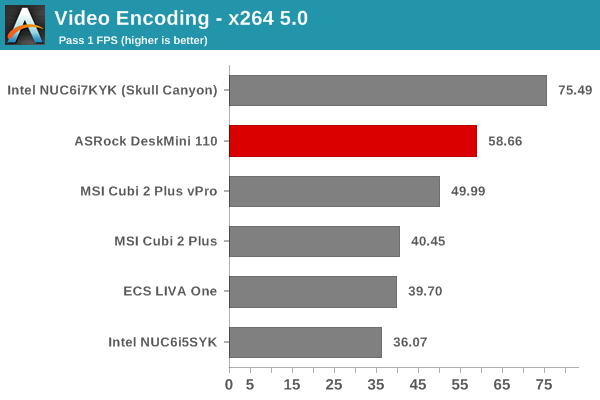
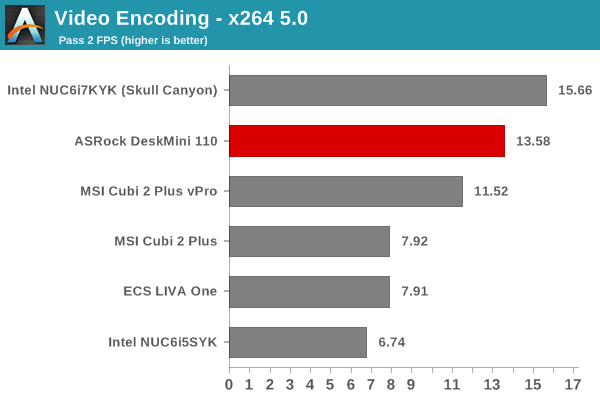
x264 Benchmark
First off, we have some video encoding benchmarks courtesy of x264 HD Benchmark v5.0. This is simply a test of CPU performance. As expected, the Core i7-6770HQ in Skull Canyon is able to surpass the Core i5-6500 in the DeskMini.
7-Zip
7-Zip is a very effective and efficient compression program, often beating out OpenCL accelerated commercial programs in benchmarks even while using just the CPU power. 7-Zip has a benchmarking program that provides tons of details regarding the underlying CPU's efficiency. In this subsection, we are interested in the compression and decompression MIPS ratings when utilizing all the available threads.


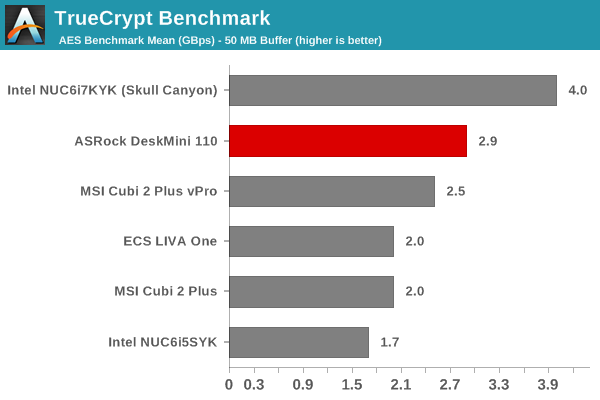
TrueCrypt
As businesses (and even home consumers) become more security conscious, the importance of encryption can't be overstated. CPUs supporting the AES-NI instruction can accelerate the encryption and decryption processes. The Core i5-6500 has AES-NI support. TrueCrypt, a popular open-source disk encryption program can take advantage of the AES-NI capabilities. The TrueCrypt internal benchmark provides some interesting cryptography-related numbers to ponder. In the graph below, we can get an idea of how fast a TrueCrypt volume would behave in the ASRock DeskMini 110 and how it would compare with other select PCs. This is a purely CPU feature / clock speed based test.
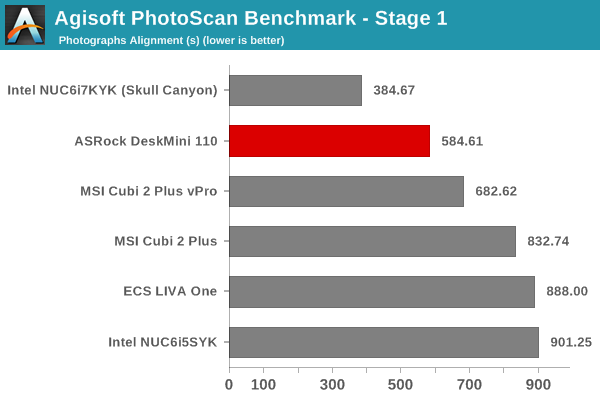
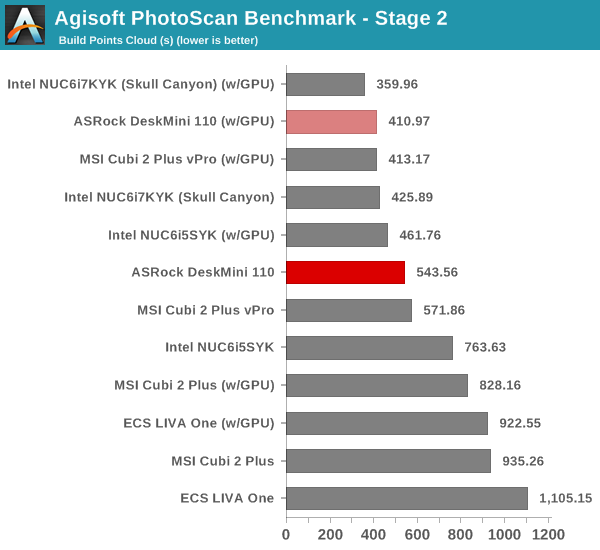
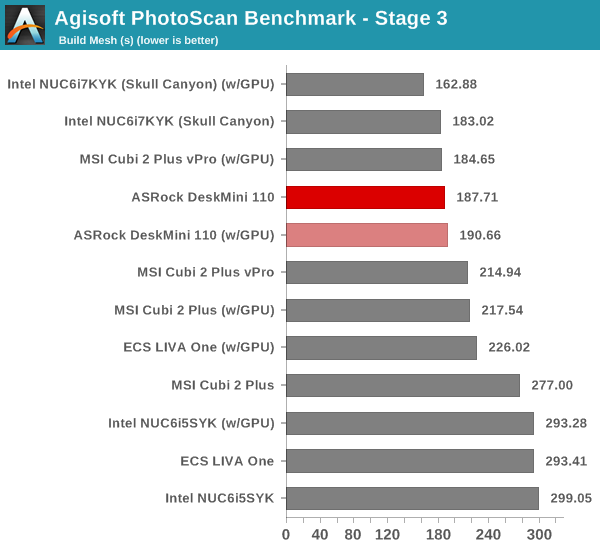
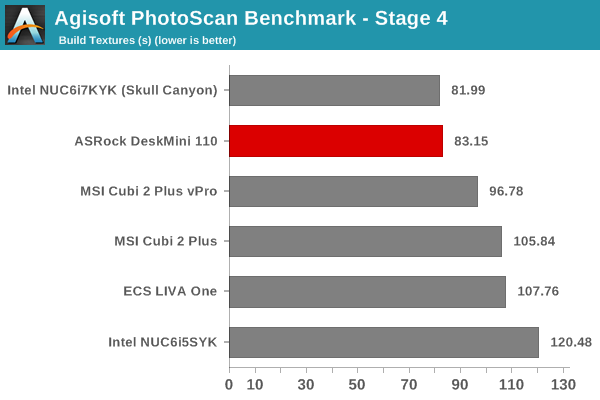
Agisoft Photoscan
Agisoft PhotoScan is a commercial program that converts 2D images into 3D point maps, meshes and textures. The program designers sent us a command line version in order to evaluate the efficiency of various systems that go under our review scanner. The command line version has two benchmark modes, one using the CPU and the other using both the CPU and GPU (via OpenCL). The benchmark takes around 50 photographs and does four stages of computation:
- Stage 1: Align Photographs
- Stage 2: Build Point Cloud (capable of OpenCL acceleration)
- Stage 3: Build Mesh
- Stage 4: Build Textures
We record the time taken for each stage. Since various elements of the software are single threaded, others multithreaded, and some use GPUs, it is interesting to record the effects of CPU generations, speeds, number of cores, DRAM parameters and the GPU using this software.
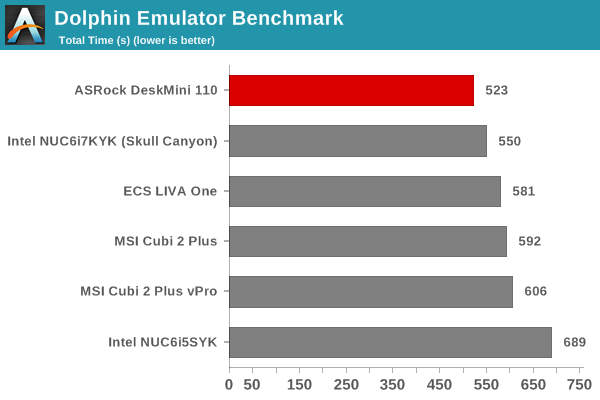
Dolphin Emulator
Wrapping up our application benchmark numbers is the Dolphin Emulator benchmark mode results. This is again a test of the CPU capabilities, leaning more towards single-threaded performance. Therefore, the higher clock speed / TDP of the Core i5-6500 helps it to come out on top in this benchmark.
Networking and Storage Performance
Networking and storage are two major aspects which influence our experience with any computing system. This section presents results from our evaluation of these aspects in the ASRock DeskMini 110. On the storage side, one option would be repetition of our strenuous SSD review tests on the drive(s) in the PC. Fortunately, to avoid that overkill, PCMark 8 has a storage bench where certain common workloads such as loading games and document processing are replayed on the target drive. Results are presented in two forms, one being a benchmark number and the other, a bandwidth figure. We ran the PCMark 8 storage bench on selected PCs and the results are presented below.
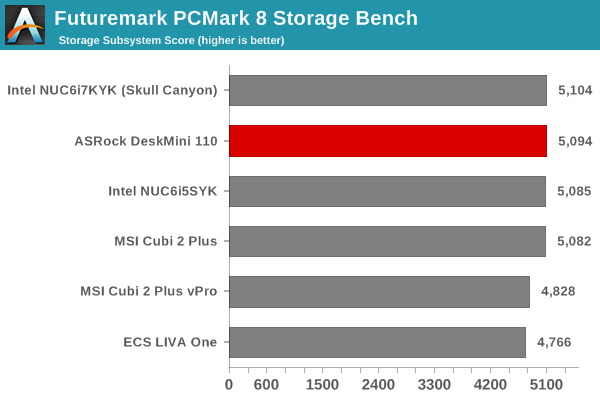
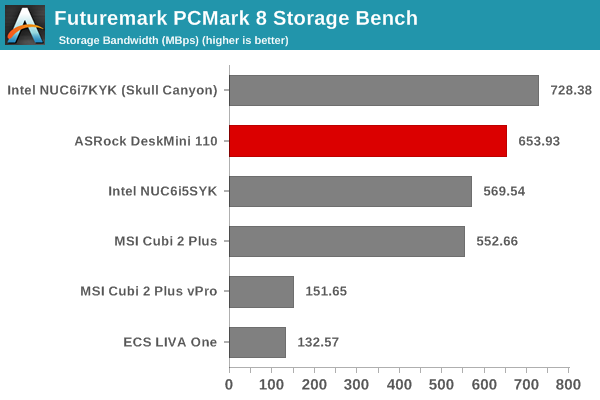
Despite using the same SSD, we do see some difference in scores between Skull Canyon and the DeskMini. This probably results from differences in the CPU capabilities, since the storage bandwidth actually reflects the amount of time that the CPU was waiting on at least one I/O request to the disk.
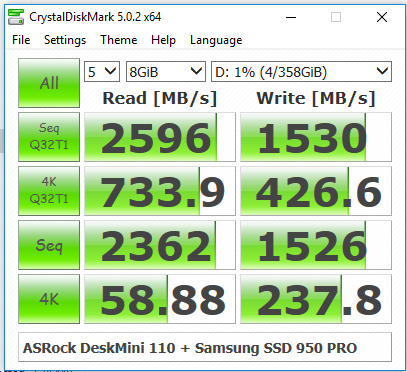
The important aspect to test from the DeskMini viewpoint is PCIe 3.0 x4 support (since the H110 has only PCIe 2.0 support). We ran the quick CrystalDiskMark check and could see that the Samsung SSD 950 PRO showed its quoted performance numbers.
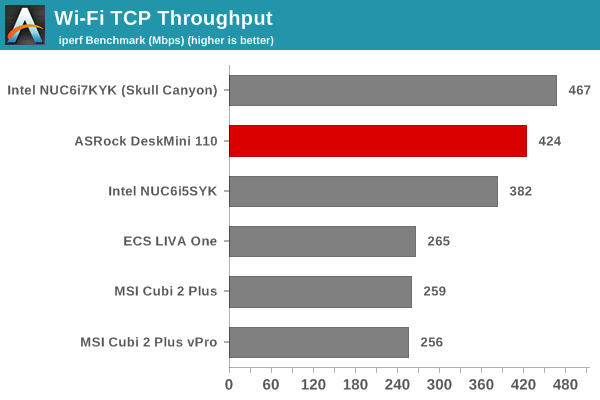
On the networking side, we restricted ourselves to the evaluation of the WLAN component. Our standard test router is the Netgear R7000 Nighthawk configured with both 2.4 GHz and 5 GHz networks. The router is placed approximately 20 ft. away, separated by a drywall (as in a typical US building). A wired client is connected to the R7000 and serves as one endpoint for iperf evaluation. The PC under test is made to connect to either the 5 GHz (preferred) or 2.4 GHz SSID and iperf tests are conducted for both TCP and UDP transfers. It is ensured that the PC under test is the only wireless client for the Netgear R7000. We evaluate total throughput for up to 32 simultaneous TCP connections using iperf and present the highest number in the graph below.
In the UDP case, we try to transfer data at the highest rate possible for which we get less than 1% packet loss.
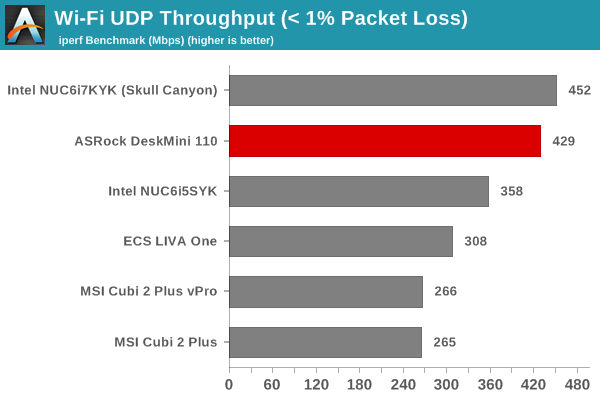
Our main aim with the WLAN component was to show that the DeskMini could indeed support a M.2 PCIe WLAN module. Intel actually provided us with a AC8260 card meant for the Skull Canyon NUC. Therefore, the antenna type we got was really not a good fit for the all-metal chassis. We ended up doing the above evaluation with the antennae not mounted to the chassis, but just hanging out of the system. Despite this unwieldy setup, the system had no trouble getting good numbers in our bandwidth test.
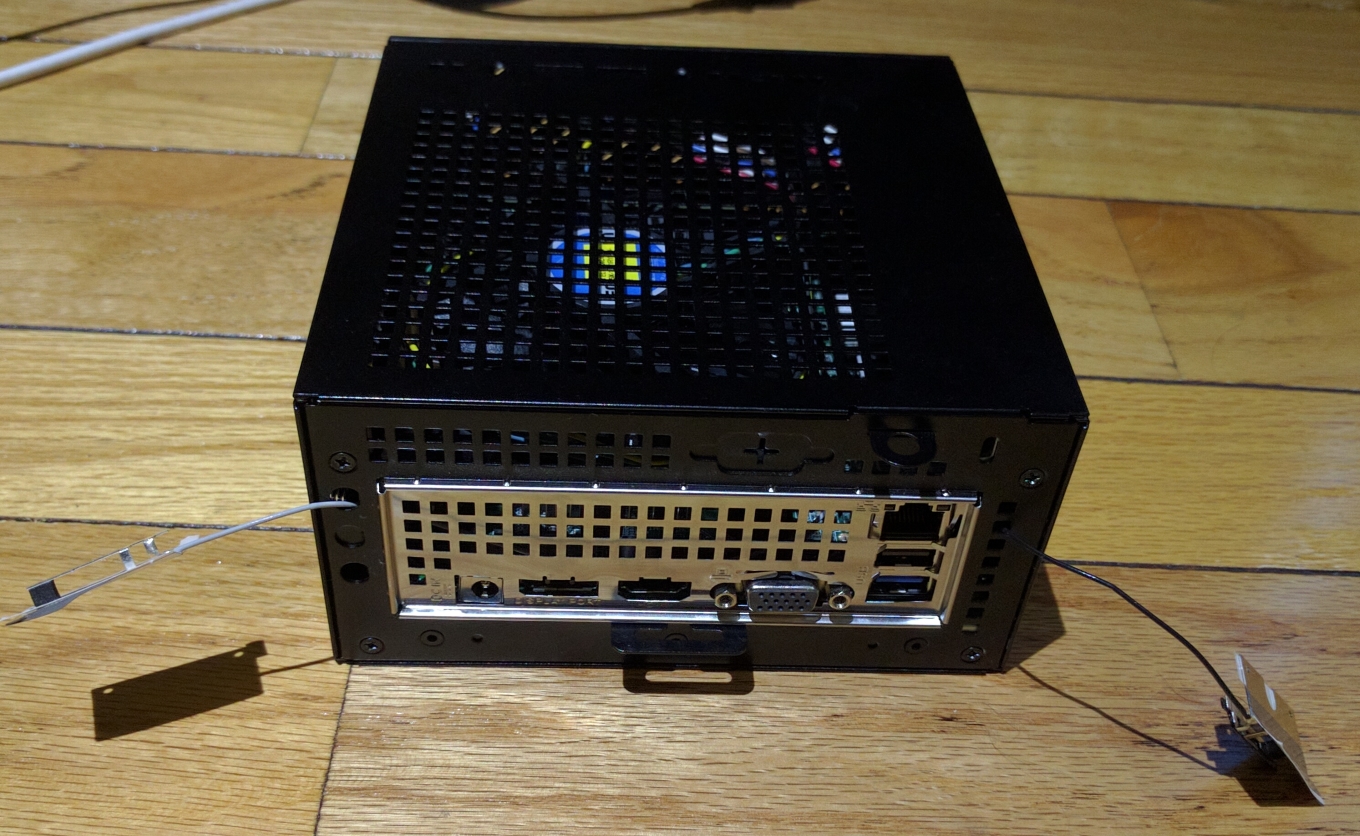
The DeskMini chassis does provide three perforations diagonally across the M.2 WLAN slot in the rear to install screw-type antennas. Consumers can keep this in mind while hunting for the appropriate WLAN component to complete a DeskMini build.
HTPC Credentials
The DeskMini's ventilated chassis (allowing for rapid cooling) and the BIOS fan control ensure that fan noise is not a concern at all for typical office workloads or light HTPC duties. The Intel HD Graphics 530 is a known quantity when it comes to refresh rate accuracy and decoding / rendering efficiency. Therefore, we will only address the network streaming efficiency aspect in this section.
Network Streaming Efficiency
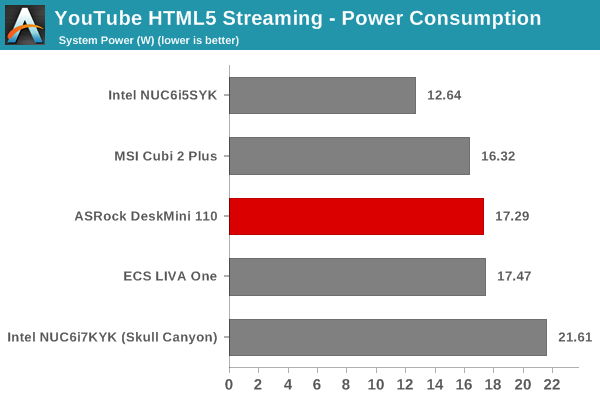
Evaluation of OTT playback efficiency was done by playing back our standard YouTube test stream and five minutes from our standard Netflix test title. Using HTML5, the YouTube stream plays back a 1080p H.264 encoding. Since YouTube now defaults to HTML5 for video playback, we have stopped evaluating Adobe Flash acceleration. Note that only NVIDIA exposes GPU and VPU loads separately. Both Intel and AMD bundle the decoder load along with the GPU load. The following two graphs show the power consumption at the wall for playback of the HTML5 stream in Mozilla Firefox (v 46.0.1).
GPU load was around 19.24% for the YouTube HTML5 stream and 0.01% for the steady state 6 Mbps Netflix streaming case.
Netflix streaming evaluation was done using the Windows 10 Netflix app. Manual stream selection is available (Ctrl-Alt-Shift-S) and debug information / statistics can also be viewed (Ctrl-Alt-Shift-D). Statistics collected for the YouTube streaming experiment were also collected here.
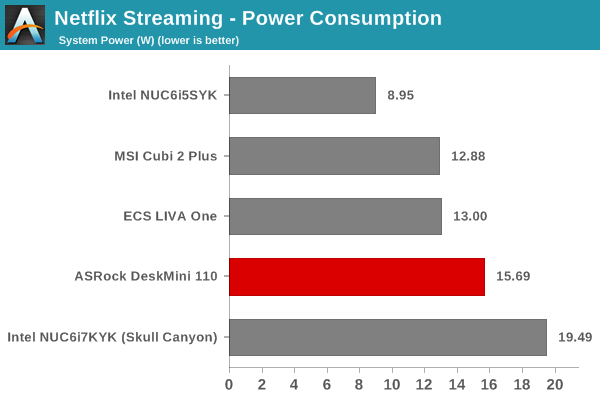
The DeskMini is not particularly power-efficient as a HTPC platform. However, for a multi-purpose PC that might be used to play YouTube videos or the occasional Netflix video, it does help to know that power consumption and fan noise are not going to be a major concern.
Power Consumption and Thermal Performance
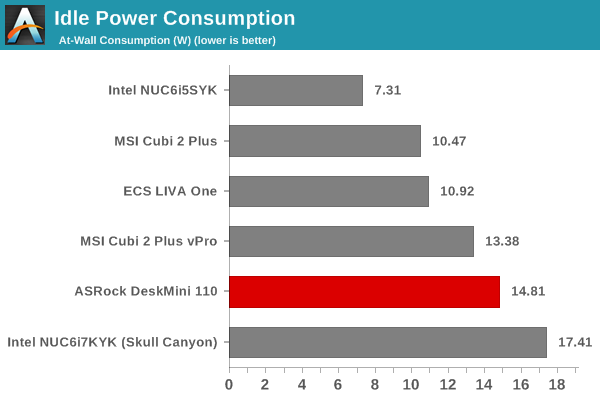
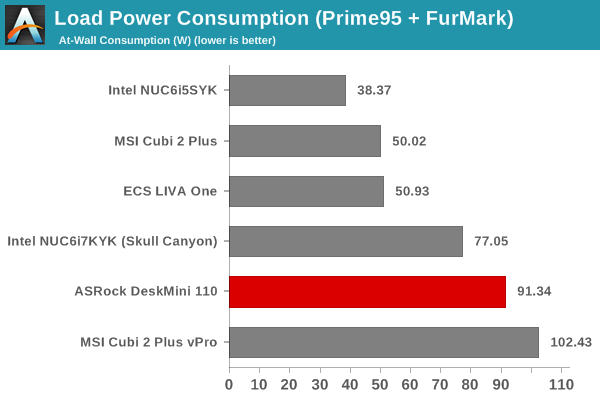
The power consumption at the wall was measured with a 1080p display being driven through the HDMI port. In the graphs below, we compare the idle and load power of the ASRock DeskMini 110 with other low power PCs evaluated before. For load power consumption, we ran Furmark 1.12.0 and Prime95 v27.9 together. The numbers are what one might expect for the combination of hardware components in the machine.
Our thermal stress routine starts with the system at idle, followed by 30 minutes of pure CPU loading. This is followed by another 30 minutes of both CPU and GPU being loaded simultaneously. After this, the CPU load gets removed, allowing the GPU to be loaded alone for another 30 minutes. The various clocks in the system as well as the temperatures within the unit are presented below.


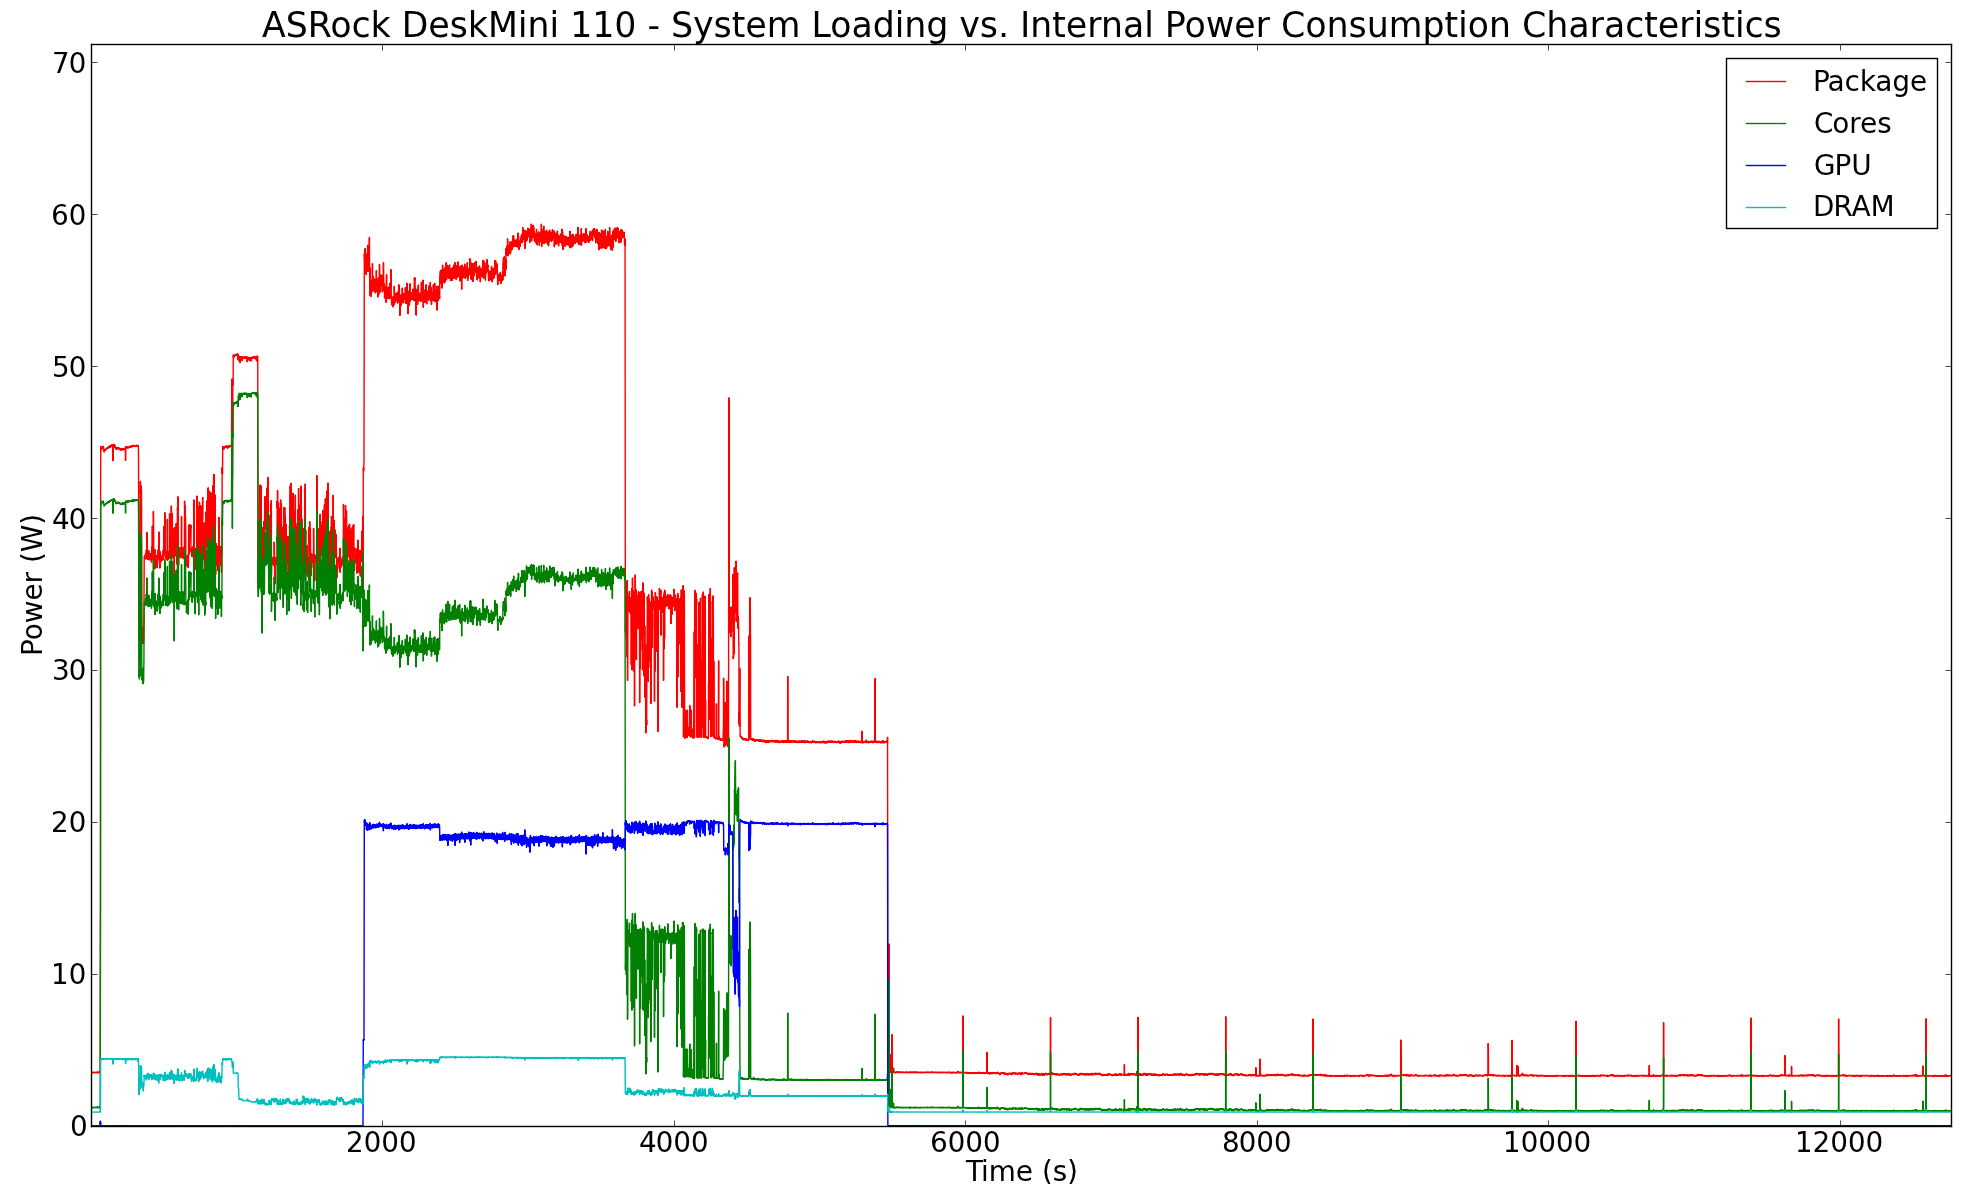
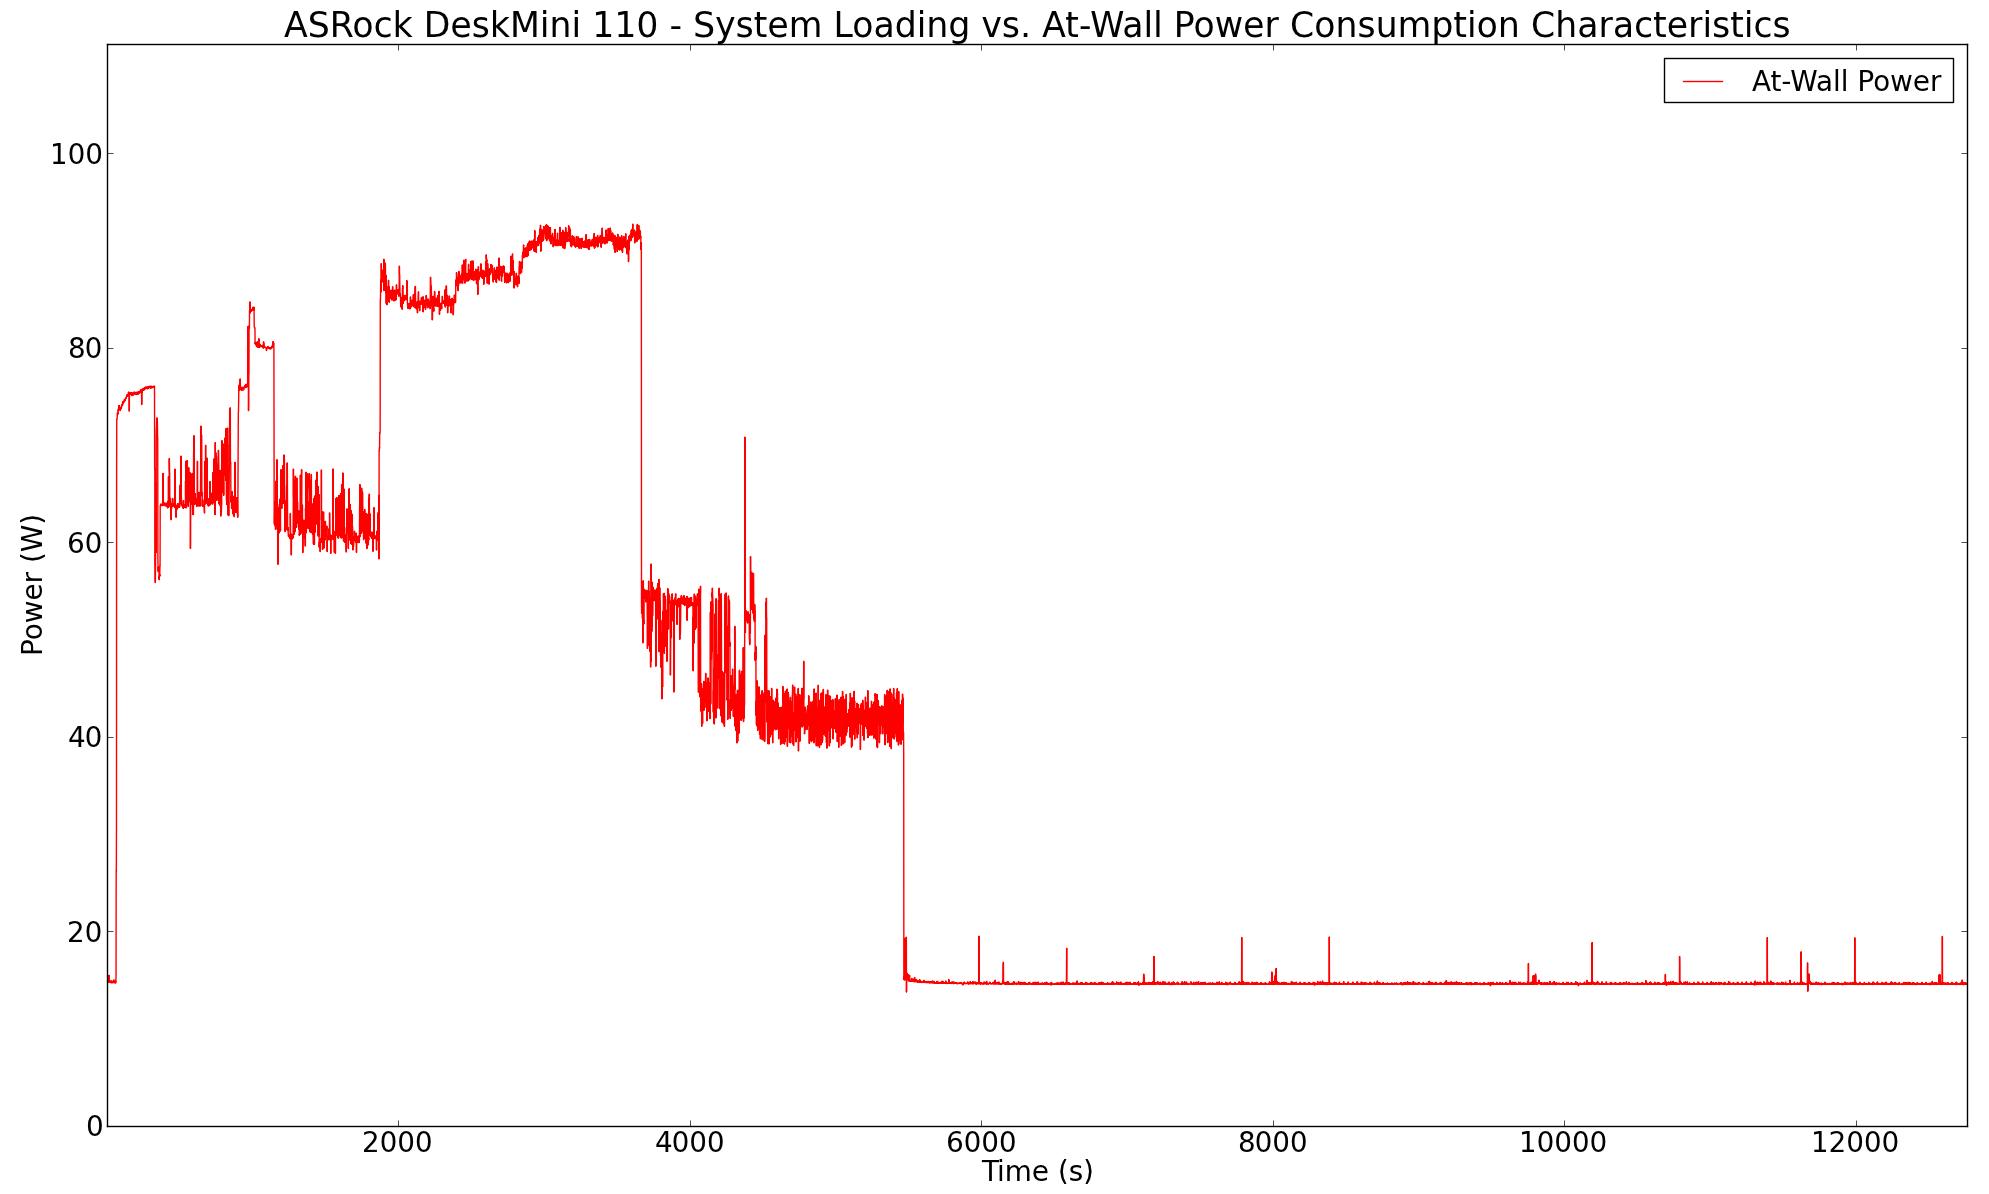
According to the official specifications, the Tcase of the Core i5-6500 is 71C, and the BIOS performance curves are set to ensure that the processor doesn't go beyond that even under stress. Therefore, we see very strange package power / at-wall power consumption in the pure CPU loading case. However, things do stabilize at a higher power number when both the CPU and the GPU are loaded together.
Another important aspect to keep note of while evaluating small form-factor PCs is the chassis temperature. Using the Android version of the FLIR One thermal imager, we observed the chassis temperature after the CPU package temperature reached the steady state value in the above graph.
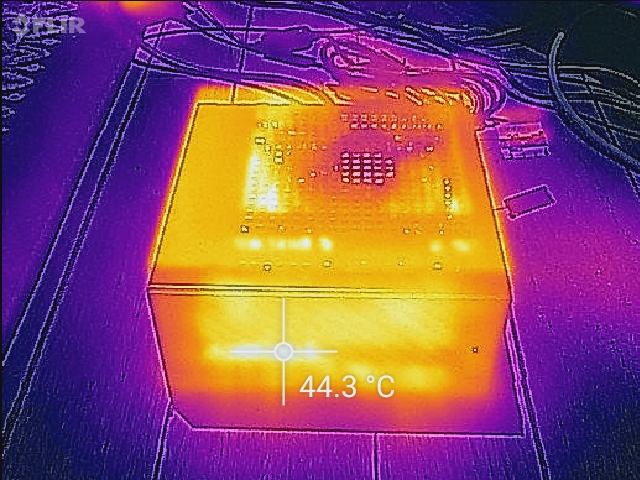
We have additional thermal images in the gallery below. The chassis temperatures are not a big concern even under extreme loading conditions.


Concluding Remarks
The ASRock DeskMini 110 gave us the opportunity to check out what is possible with the mini-STX form factor and a high-TDP Skylake CPU. It is quite clear that Intel's current marketing angle with the mini-STX form factor is affordability. Otherwise, it is difficult to explain why almost all vendors have gone in for a H110 chipset-based design for their mini-STX offerings. That said, ASRock has put in a couple of good differentiating aspects in the DeskMini 110: support for 65W TDP CPUs and a M.2 PCIe slot for SSDs directly connected to the CPU's PCIe lanes. This works around the issue of the H110 chipset having only PCIe 2.0 lanes
The pricing is very competitive - $130 for the all-metal chassis, 120W power adapter and cord, and the H110 motherboard. While the assembly is not as easy as that of a NUC, it is acceptable for the DIY market.

In terms of scope for improvement, a bundled WLAN adapter would be very welcome. Sourcing one that can fit in with the chassis design will be a challenge, as most M.2 PCIe WLAN modules are either meant for NUCs, or for notebooks. The DeskMini's all-metal chassis makes it difficult to get a suitable placement for the flat antennae that come with such WLAN adapters. I think it would be better for ASRock to bundle / pre-install a WLAN module and antennas for a slight increase in the price of the product. The DeskMini could also do with some additional I/O (say, a SD card reader).
It is great to see the mini-STX form factor getting broad vendor support. We would like it more if vendors were able to differentiate their offerings. ASRock has tried out a few things differently in the storage subsystem and chassis design with the DeskMini 110. We look forward to seeing what other differentiation aspects come out in the future iterations in this product line.


